Indian (Asian) vs Yugoslavian Hearing Disability
COMPARE
Indian (Asian)
Yugoslavian
Hearing Disability
Hearing Disability Comparison
Indians (Asian)
Yugoslavians
2.7%
HEARING DISABILITY
98.4/ 100
METRIC RATING
63rd/ 347
METRIC RANK
3.3%
HEARING DISABILITY
1.0/ 100
METRIC RATING
242nd/ 347
METRIC RANK
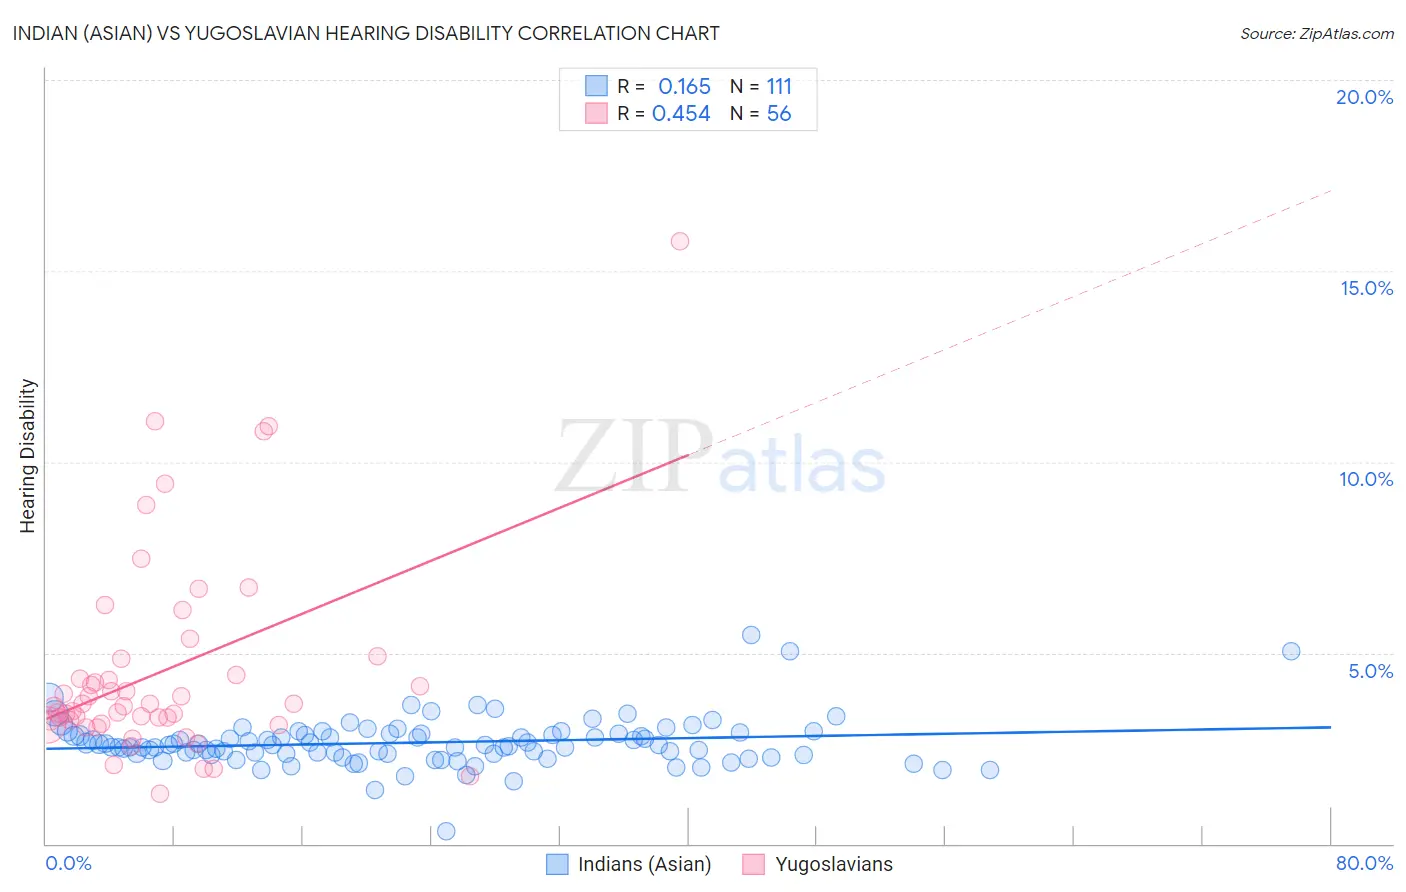
Indian (Asian) vs Yugoslavian Hearing Disability Correlation Chart
The statistical analysis conducted on geographies consisting of 494,958,947 people shows a poor positive correlation between the proportion of Indians (Asian) and percentage of population with hearing disability in the United States with a correlation coefficient (R) of 0.165 and weighted average of 2.7%. Similarly, the statistical analysis conducted on geographies consisting of 285,663,811 people shows a moderate positive correlation between the proportion of Yugoslavians and percentage of population with hearing disability in the United States with a correlation coefficient (R) of 0.454 and weighted average of 3.3%, a difference of 22.5%.
Hearing Disability Correlation Summary
| Measurement | Indian (Asian) | Yugoslavian |
| Minimum | 0.32% | 1.3% |
| Maximum | 5.5% | 15.8% |
| Range | 5.1% | 14.5% |
| Mean | 2.6% | 4.5% |
| Median | 2.6% | 3.6% |
| Interquartile 25% (IQ1) | 2.3% | 3.2% |
| Interquartile 75% (IQ3) | 2.9% | 4.6% |
| Interquartile Range (IQR) | 0.54% | 1.5% |
| Standard Deviation (Sample) | 0.64% | 2.7% |
| Standard Deviation (Population) | 0.64% | 2.7% |
Similar Demographics by Hearing Disability
Demographics Similar to Indians (Asian) by Hearing Disability
In terms of hearing disability, the demographic groups most similar to Indians (Asian) are Immigrants from Colombia (2.7%, a difference of 0.050%), Immigrants from Sri Lanka (2.7%, a difference of 0.050%), Immigrants from Uzbekistan (2.7%, a difference of 0.060%), Immigrants from Nepal (2.7%, a difference of 0.14%), and Immigrants from Egypt (2.7%, a difference of 0.19%).
| Demographics | Rating | Rank | Hearing Disability |
| Immigrants | Nicaragua | 99.0 /100 | #56 | Exceptional 2.7% |
| South Americans | 99.0 /100 | #57 | Exceptional 2.7% |
| Immigrants | Peru | 98.6 /100 | #58 | Exceptional 2.7% |
| Immigrants | Eritrea | 98.5 /100 | #59 | Exceptional 2.7% |
| Immigrants | Egypt | 98.5 /100 | #60 | Exceptional 2.7% |
| Immigrants | Uzbekistan | 98.4 /100 | #61 | Exceptional 2.7% |
| Immigrants | Colombia | 98.4 /100 | #62 | Exceptional 2.7% |
| Indians (Asian) | 98.4 /100 | #63 | Exceptional 2.7% |
| Immigrants | Sri Lanka | 98.4 /100 | #64 | Exceptional 2.7% |
| Immigrants | Nepal | 98.3 /100 | #65 | Exceptional 2.7% |
| Immigrants | Belize | 98.2 /100 | #66 | Exceptional 2.7% |
| Egyptians | 98.1 /100 | #67 | Exceptional 2.7% |
| Immigrants | Africa | 98.0 /100 | #68 | Exceptional 2.7% |
| Nicaraguans | 97.9 /100 | #69 | Exceptional 2.7% |
| Peruvians | 97.7 /100 | #70 | Exceptional 2.7% |
Demographics Similar to Yugoslavians by Hearing Disability
In terms of hearing disability, the demographic groups most similar to Yugoslavians are Samoan (3.3%, a difference of 0.11%), Immigrants from Western Europe (3.3%, a difference of 0.17%), Immigrants from Netherlands (3.3%, a difference of 0.18%), Assyrian/Chaldean/Syriac (3.3%, a difference of 0.24%), and Nepalese (3.3%, a difference of 0.36%).
| Demographics | Rating | Rank | Hearing Disability |
| Guamanians/Chamorros | 2.2 /100 | #235 | Tragic 3.3% |
| Serbians | 2.2 /100 | #236 | Tragic 3.3% |
| Immigrants | Austria | 1.8 /100 | #237 | Tragic 3.3% |
| German Russians | 1.8 /100 | #238 | Tragic 3.3% |
| Nepalese | 1.2 /100 | #239 | Tragic 3.3% |
| Immigrants | Netherlands | 1.1 /100 | #240 | Tragic 3.3% |
| Samoans | 1.1 /100 | #241 | Tragic 3.3% |
| Yugoslavians | 1.0 /100 | #242 | Tragic 3.3% |
| Immigrants | Western Europe | 1.0 /100 | #243 | Tragic 3.3% |
| Assyrians/Chaldeans/Syriacs | 0.9 /100 | #244 | Tragic 3.3% |
| Immigrants | Scotland | 0.8 /100 | #245 | Tragic 3.3% |
| Immigrants | England | 0.7 /100 | #246 | Tragic 3.3% |
| Lithuanians | 0.6 /100 | #247 | Tragic 3.4% |
| Austrians | 0.6 /100 | #248 | Tragic 3.4% |
| Italians | 0.4 /100 | #249 | Tragic 3.4% |