Immigrants vs Maltese Single Mother Poverty
COMPARE
Immigrants
Maltese
Single Mother Poverty
Single Mother Poverty Comparison
Immigrants
Maltese
29.7%
SINGLE MOTHER POVERTY
16.6/ 100
METRIC RATING
204th/ 347
METRIC RANK
26.6%
SINGLE MOTHER POVERTY
99.9/ 100
METRIC RATING
35th/ 347
METRIC RANK
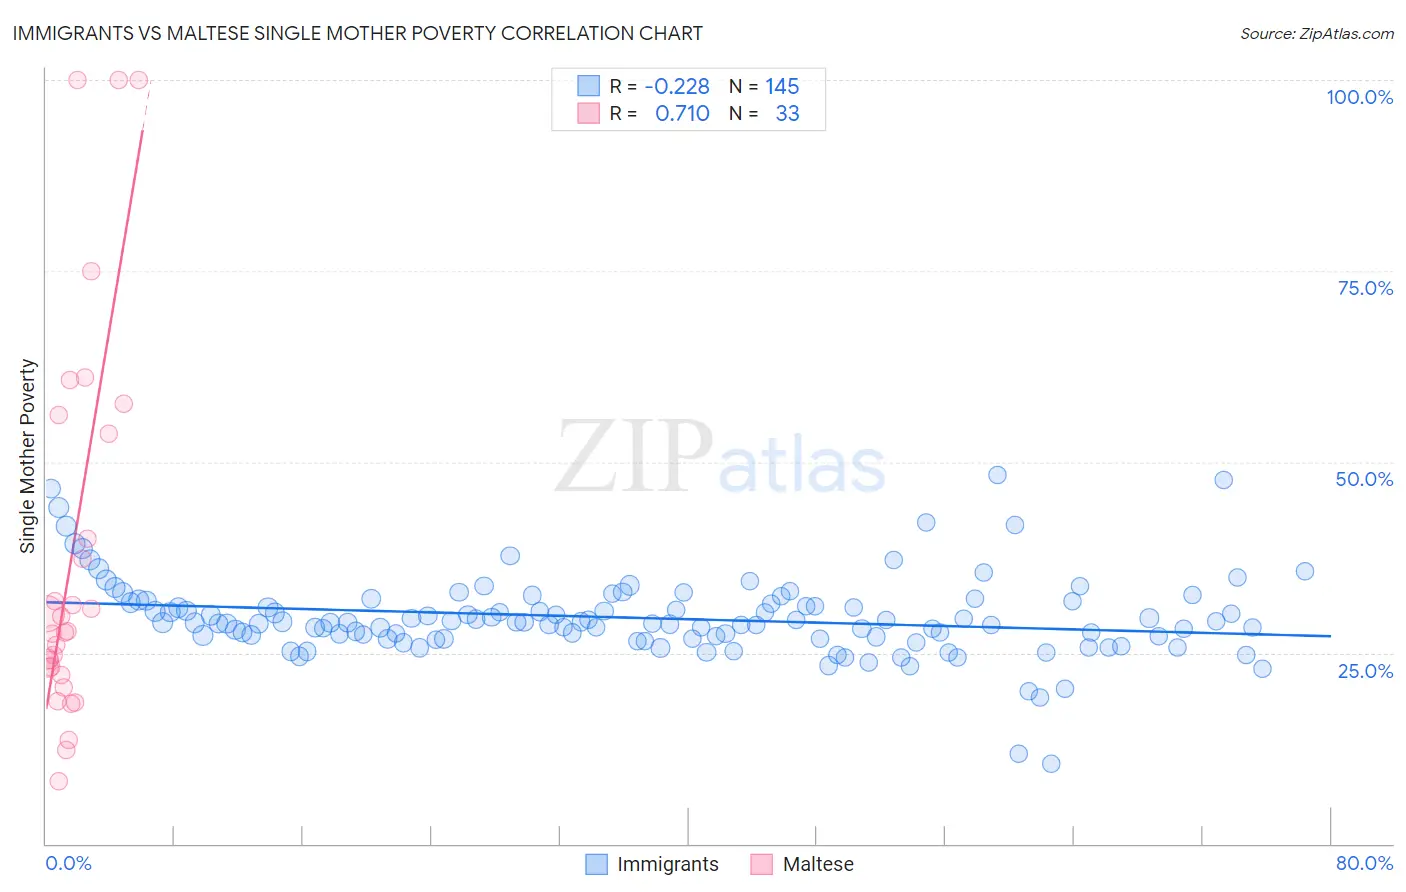
Immigrants vs Maltese Single Mother Poverty Correlation Chart
The statistical analysis conducted on geographies consisting of 548,894,561 people shows a weak negative correlation between the proportion of Immigrants and poverty level among single mothers in the United States with a correlation coefficient (R) of -0.228 and weighted average of 29.7%. Similarly, the statistical analysis conducted on geographies consisting of 124,400,291 people shows a strong positive correlation between the proportion of Maltese and poverty level among single mothers in the United States with a correlation coefficient (R) of 0.710 and weighted average of 26.6%, a difference of 11.8%.
Single Mother Poverty Correlation Summary
| Measurement | Immigrants | Maltese |
| Minimum | 10.6% | 8.2% |
| Maximum | 48.3% | 100.0% |
| Range | 37.7% | 91.8% |
| Mean | 29.6% | 38.1% |
| Median | 29.0% | 27.8% |
| Interquartile 25% (IQ1) | 27.0% | 22.6% |
| Interquartile 75% (IQ3) | 31.7% | 54.9% |
| Interquartile Range (IQR) | 4.7% | 32.3% |
| Standard Deviation (Sample) | 5.3% | 25.3% |
| Standard Deviation (Population) | 5.3% | 24.9% |
Similar Demographics by Single Mother Poverty
Demographics Similar to Immigrants by Single Mother Poverty
In terms of single mother poverty, the demographic groups most similar to Immigrants are Czechoslovakian (29.7%, a difference of 0.040%), Swiss (29.7%, a difference of 0.050%), Immigrants from Haiti (29.7%, a difference of 0.060%), Malaysian (29.7%, a difference of 0.070%), and Immigrants from Panama (29.8%, a difference of 0.090%).
| Demographics | Rating | Rank | Single Mother Poverty |
| Immigrants | Jamaica | 22.0 /100 | #197 | Fair 29.6% |
| Trinidadians and Tobagonians | 21.7 /100 | #198 | Fair 29.6% |
| Cubans | 20.8 /100 | #199 | Fair 29.6% |
| Panamanians | 20.0 /100 | #200 | Fair 29.6% |
| Belgians | 18.8 /100 | #201 | Poor 29.7% |
| Malaysians | 17.4 /100 | #202 | Poor 29.7% |
| Swiss | 17.2 /100 | #203 | Poor 29.7% |
| Immigrants | Immigrants | 16.6 /100 | #204 | Poor 29.7% |
| Czechoslovakians | 16.1 /100 | #205 | Poor 29.7% |
| Immigrants | Haiti | 15.8 /100 | #206 | Poor 29.7% |
| Immigrants | Panama | 15.5 /100 | #207 | Poor 29.8% |
| Immigrants | Guyana | 14.7 /100 | #208 | Poor 29.8% |
| Irish | 13.9 /100 | #209 | Poor 29.8% |
| Haitians | 13.3 /100 | #210 | Poor 29.8% |
| Guyanese | 12.8 /100 | #211 | Poor 29.8% |
Demographics Similar to Maltese by Single Mother Poverty
In terms of single mother poverty, the demographic groups most similar to Maltese are Okinawan (26.6%, a difference of 0.050%), Immigrants from Israel (26.6%, a difference of 0.050%), Immigrants from Fiji (26.6%, a difference of 0.090%), Immigrants from Indonesia (26.6%, a difference of 0.12%), and Bulgarian (26.5%, a difference of 0.13%).
| Demographics | Rating | Rank | Single Mother Poverty |
| Koreans | 100.0 /100 | #28 | Exceptional 26.4% |
| Jordanians | 100.0 /100 | #29 | Exceptional 26.4% |
| Turks | 100.0 /100 | #30 | Exceptional 26.4% |
| Immigrants | Philippines | 100.0 /100 | #31 | Exceptional 26.5% |
| Tongans | 99.9 /100 | #32 | Exceptional 26.5% |
| Bulgarians | 99.9 /100 | #33 | Exceptional 26.5% |
| Immigrants | Indonesia | 99.9 /100 | #34 | Exceptional 26.6% |
| Maltese | 99.9 /100 | #35 | Exceptional 26.6% |
| Okinawans | 99.9 /100 | #36 | Exceptional 26.6% |
| Immigrants | Israel | 99.9 /100 | #37 | Exceptional 26.6% |
| Immigrants | Fiji | 99.9 /100 | #38 | Exceptional 26.6% |
| Sri Lankans | 99.9 /100 | #39 | Exceptional 26.7% |
| Immigrants | Vietnam | 99.9 /100 | #40 | Exceptional 26.7% |
| Immigrants | Greece | 99.9 /100 | #41 | Exceptional 26.7% |
| Armenians | 99.9 /100 | #42 | Exceptional 26.8% |