Immigrants vs Immigrants from Belize Single Mother Poverty
COMPARE
Immigrants
Immigrants from Belize
Single Mother Poverty
Single Mother Poverty Comparison
Immigrants
Immigrants from Belize
29.7%
SINGLE MOTHER POVERTY
16.6/ 100
METRIC RATING
204th/ 347
METRIC RANK
31.4%
SINGLE MOTHER POVERTY
0.2/ 100
METRIC RATING
267th/ 347
METRIC RANK
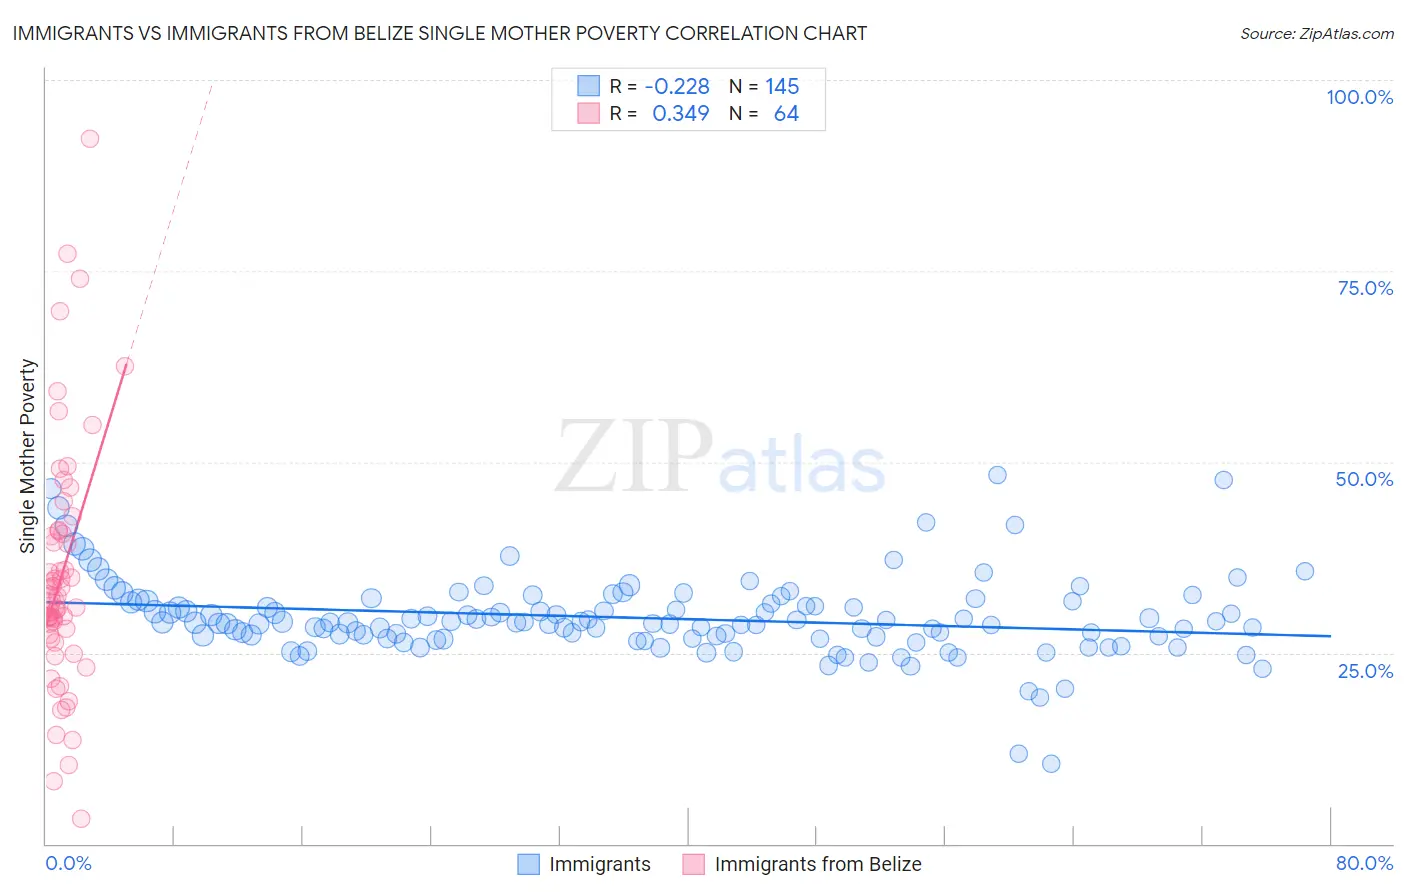
Immigrants vs Immigrants from Belize Single Mother Poverty Correlation Chart
The statistical analysis conducted on geographies consisting of 548,894,561 people shows a weak negative correlation between the proportion of Immigrants and poverty level among single mothers in the United States with a correlation coefficient (R) of -0.228 and weighted average of 29.7%. Similarly, the statistical analysis conducted on geographies consisting of 129,542,917 people shows a mild positive correlation between the proportion of Immigrants from Belize and poverty level among single mothers in the United States with a correlation coefficient (R) of 0.349 and weighted average of 31.4%, a difference of 5.7%.
Single Mother Poverty Correlation Summary
| Measurement | Immigrants | Immigrants from Belize |
| Minimum | 10.6% | 3.2% |
| Maximum | 48.3% | 92.3% |
| Range | 37.7% | 89.1% |
| Mean | 29.6% | 35.1% |
| Median | 29.0% | 31.7% |
| Interquartile 25% (IQ1) | 27.0% | 27.1% |
| Interquartile 75% (IQ3) | 31.7% | 40.7% |
| Interquartile Range (IQR) | 4.7% | 13.5% |
| Standard Deviation (Sample) | 5.3% | 16.3% |
| Standard Deviation (Population) | 5.3% | 16.1% |
Similar Demographics by Single Mother Poverty
Demographics Similar to Immigrants by Single Mother Poverty
In terms of single mother poverty, the demographic groups most similar to Immigrants are Czechoslovakian (29.7%, a difference of 0.040%), Swiss (29.7%, a difference of 0.050%), Immigrants from Haiti (29.7%, a difference of 0.060%), Malaysian (29.7%, a difference of 0.070%), and Immigrants from Panama (29.8%, a difference of 0.090%).
| Demographics | Rating | Rank | Single Mother Poverty |
| Immigrants | Jamaica | 22.0 /100 | #197 | Fair 29.6% |
| Trinidadians and Tobagonians | 21.7 /100 | #198 | Fair 29.6% |
| Cubans | 20.8 /100 | #199 | Fair 29.6% |
| Panamanians | 20.0 /100 | #200 | Fair 29.6% |
| Belgians | 18.8 /100 | #201 | Poor 29.7% |
| Malaysians | 17.4 /100 | #202 | Poor 29.7% |
| Swiss | 17.2 /100 | #203 | Poor 29.7% |
| Immigrants | Immigrants | 16.6 /100 | #204 | Poor 29.7% |
| Czechoslovakians | 16.1 /100 | #205 | Poor 29.7% |
| Immigrants | Haiti | 15.8 /100 | #206 | Poor 29.7% |
| Immigrants | Panama | 15.5 /100 | #207 | Poor 29.8% |
| Immigrants | Guyana | 14.7 /100 | #208 | Poor 29.8% |
| Irish | 13.9 /100 | #209 | Poor 29.8% |
| Haitians | 13.3 /100 | #210 | Poor 29.8% |
| Guyanese | 12.8 /100 | #211 | Poor 29.8% |
Demographics Similar to Immigrants from Belize by Single Mother Poverty
In terms of single mother poverty, the demographic groups most similar to Immigrants from Belize are Subsaharan African (31.4%, a difference of 0.15%), Immigrants from Senegal (31.5%, a difference of 0.18%), German Russian (31.3%, a difference of 0.22%), Scotch-Irish (31.5%, a difference of 0.22%), and Immigrants from Ecuador (31.3%, a difference of 0.25%).
| Demographics | Rating | Rank | Single Mother Poverty |
| Whites/Caucasians | 0.3 /100 | #260 | Tragic 31.2% |
| Immigrants | El Salvador | 0.3 /100 | #261 | Tragic 31.2% |
| Hmong | 0.3 /100 | #262 | Tragic 31.2% |
| Bahamians | 0.2 /100 | #263 | Tragic 31.3% |
| Immigrants | Ecuador | 0.2 /100 | #264 | Tragic 31.3% |
| German Russians | 0.2 /100 | #265 | Tragic 31.3% |
| Sub-Saharan Africans | 0.2 /100 | #266 | Tragic 31.4% |
| Immigrants | Belize | 0.2 /100 | #267 | Tragic 31.4% |
| Immigrants | Senegal | 0.1 /100 | #268 | Tragic 31.5% |
| Scotch-Irish | 0.1 /100 | #269 | Tragic 31.5% |
| British West Indians | 0.1 /100 | #270 | Tragic 31.5% |
| Immigrants | Cabo Verde | 0.1 /100 | #271 | Tragic 31.6% |
| Immigrants | Micronesia | 0.1 /100 | #272 | Tragic 31.6% |
| Fijians | 0.1 /100 | #273 | Tragic 31.6% |
| Bangladeshis | 0.1 /100 | #274 | Tragic 31.7% |