Immigrants vs Immigrants from Caribbean 9th Grade
COMPARE
Immigrants
Immigrants from Caribbean
9th Grade
9th Grade Comparison
Immigrants
Immigrants from Caribbean
92.5%
9TH GRADE
0.0/ 100
METRIC RATING
307th/ 347
METRIC RANK
92.2%
9TH GRADE
0.0/ 100
METRIC RATING
315th/ 347
METRIC RANK
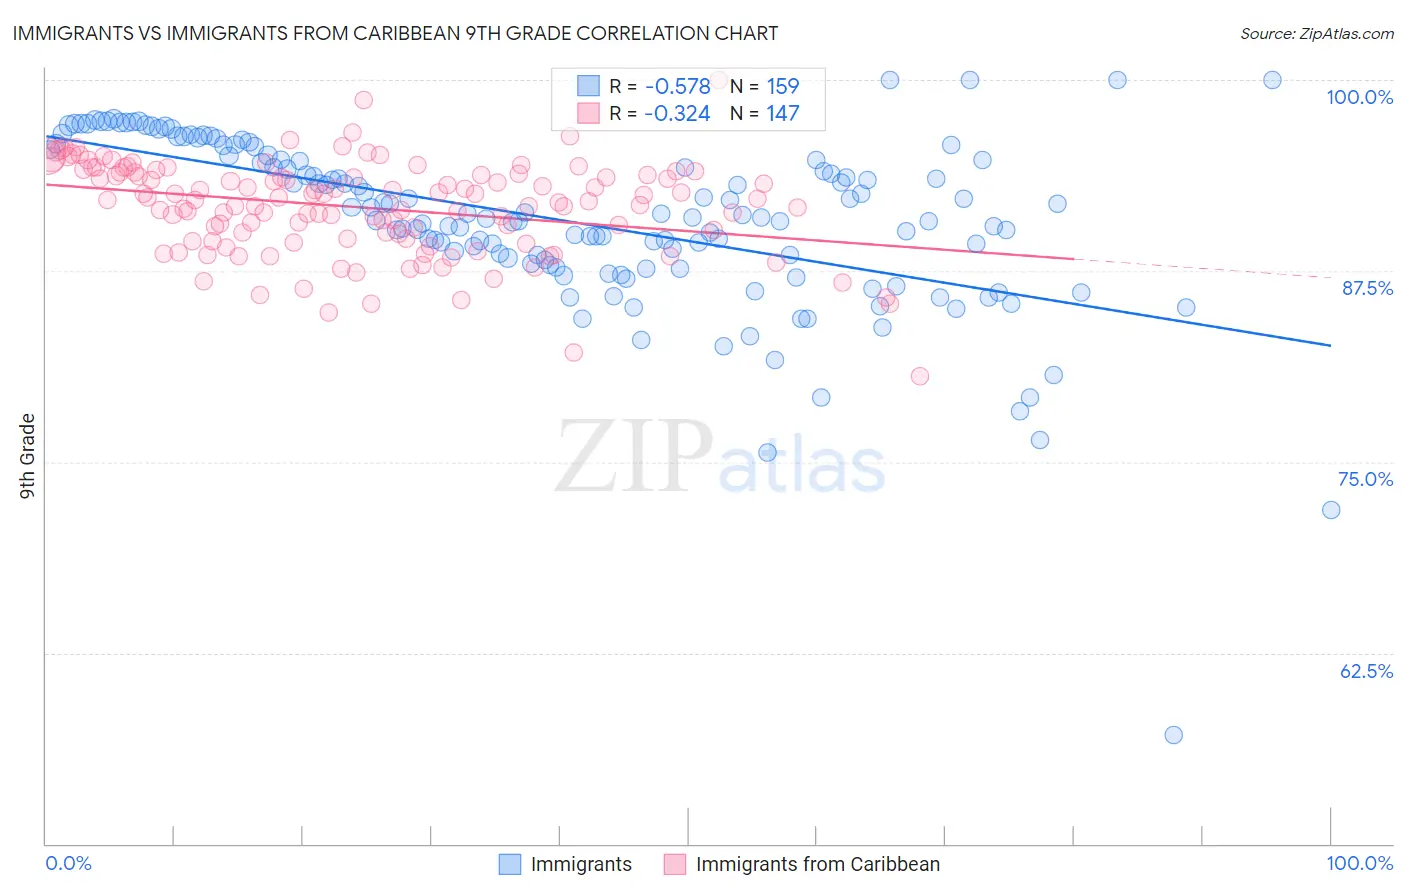
Immigrants vs Immigrants from Caribbean 9th Grade Correlation Chart
The statistical analysis conducted on geographies consisting of 577,786,659 people shows a substantial negative correlation between the proportion of Immigrants and percentage of population with at least 9th grade education in the United States with a correlation coefficient (R) of -0.578 and weighted average of 92.5%. Similarly, the statistical analysis conducted on geographies consisting of 450,064,654 people shows a mild negative correlation between the proportion of Immigrants from Caribbean and percentage of population with at least 9th grade education in the United States with a correlation coefficient (R) of -0.324 and weighted average of 92.2%, a difference of 0.31%.
9th Grade Correlation Summary
| Measurement | Immigrants | Immigrants from Caribbean |
| Minimum | 57.2% | 80.6% |
| Maximum | 100.0% | 100.0% |
| Range | 42.8% | 19.4% |
| Mean | 90.8% | 91.6% |
| Median | 91.0% | 92.1% |
| Interquartile 25% (IQ1) | 88.0% | 89.6% |
| Interquartile 75% (IQ3) | 94.8% | 93.9% |
| Interquartile Range (IQR) | 6.8% | 4.3% |
| Standard Deviation (Sample) | 5.7% | 3.1% |
| Standard Deviation (Population) | 5.7% | 3.1% |
Demographics Similar to Immigrants and Immigrants from Caribbean by 9th Grade
In terms of 9th grade, the demographic groups most similar to Immigrants are Immigrants from Guyana (92.5%, a difference of 0.010%), Japanese (92.6%, a difference of 0.10%), Immigrants from Vietnam (92.6%, a difference of 0.10%), Tohono O'odham (92.6%, a difference of 0.12%), and Guyanese (92.7%, a difference of 0.14%). Similarly, the demographic groups most similar to Immigrants from Caribbean are Immigrants from Portugal (92.2%, a difference of 0.010%), Cape Verdean (92.2%, a difference of 0.040%), Vietnamese (92.3%, a difference of 0.050%), Immigrants from Cuba (92.2%, a difference of 0.050%), and Houma (92.3%, a difference of 0.070%).
| Demographics | Rating | Rank | 9th Grade |
| Immigrants | Haiti | 0.0 /100 | #301 | Tragic 92.7% |
| Immigrants | Dominica | 0.0 /100 | #302 | Tragic 92.7% |
| Guyanese | 0.0 /100 | #303 | Tragic 92.7% |
| Tohono O'odham | 0.0 /100 | #304 | Tragic 92.6% |
| Japanese | 0.0 /100 | #305 | Tragic 92.6% |
| Immigrants | Vietnam | 0.0 /100 | #306 | Tragic 92.6% |
| Immigrants | Immigrants | 0.0 /100 | #307 | Tragic 92.5% |
| Immigrants | Guyana | 0.0 /100 | #308 | Tragic 92.5% |
| Immigrants | Bangladesh | 0.0 /100 | #309 | Tragic 92.4% |
| Immigrants | Cambodia | 0.0 /100 | #310 | Tragic 92.4% |
| Immigrants | Fiji | 0.0 /100 | #311 | Tragic 92.3% |
| Houma | 0.0 /100 | #312 | Tragic 92.3% |
| Vietnamese | 0.0 /100 | #313 | Tragic 92.3% |
| Immigrants | Portugal | 0.0 /100 | #314 | Tragic 92.2% |
| Immigrants | Caribbean | 0.0 /100 | #315 | Tragic 92.2% |
| Cape Verdeans | 0.0 /100 | #316 | Tragic 92.2% |
| Immigrants | Cuba | 0.0 /100 | #317 | Tragic 92.2% |
| Nepalese | 0.0 /100 | #318 | Tragic 92.0% |
| Ecuadorians | 0.0 /100 | #319 | Tragic 91.9% |
| Nicaraguans | 0.0 /100 | #320 | Tragic 91.9% |
| Immigrants | Ecuador | 0.0 /100 | #321 | Tragic 91.8% |