Immigrants from Yemen vs Chilean Single Male Poverty
COMPARE
Immigrants from Yemen
Chilean
Single Male Poverty
Single Male Poverty Comparison
Immigrants from Yemen
Chileans
16.9%
SINGLE MALE POVERTY
0.0/ 100
METRIC RATING
324th/ 347
METRIC RANK
11.9%
SINGLE MALE POVERTY
99.5/ 100
METRIC RATING
74th/ 347
METRIC RANK
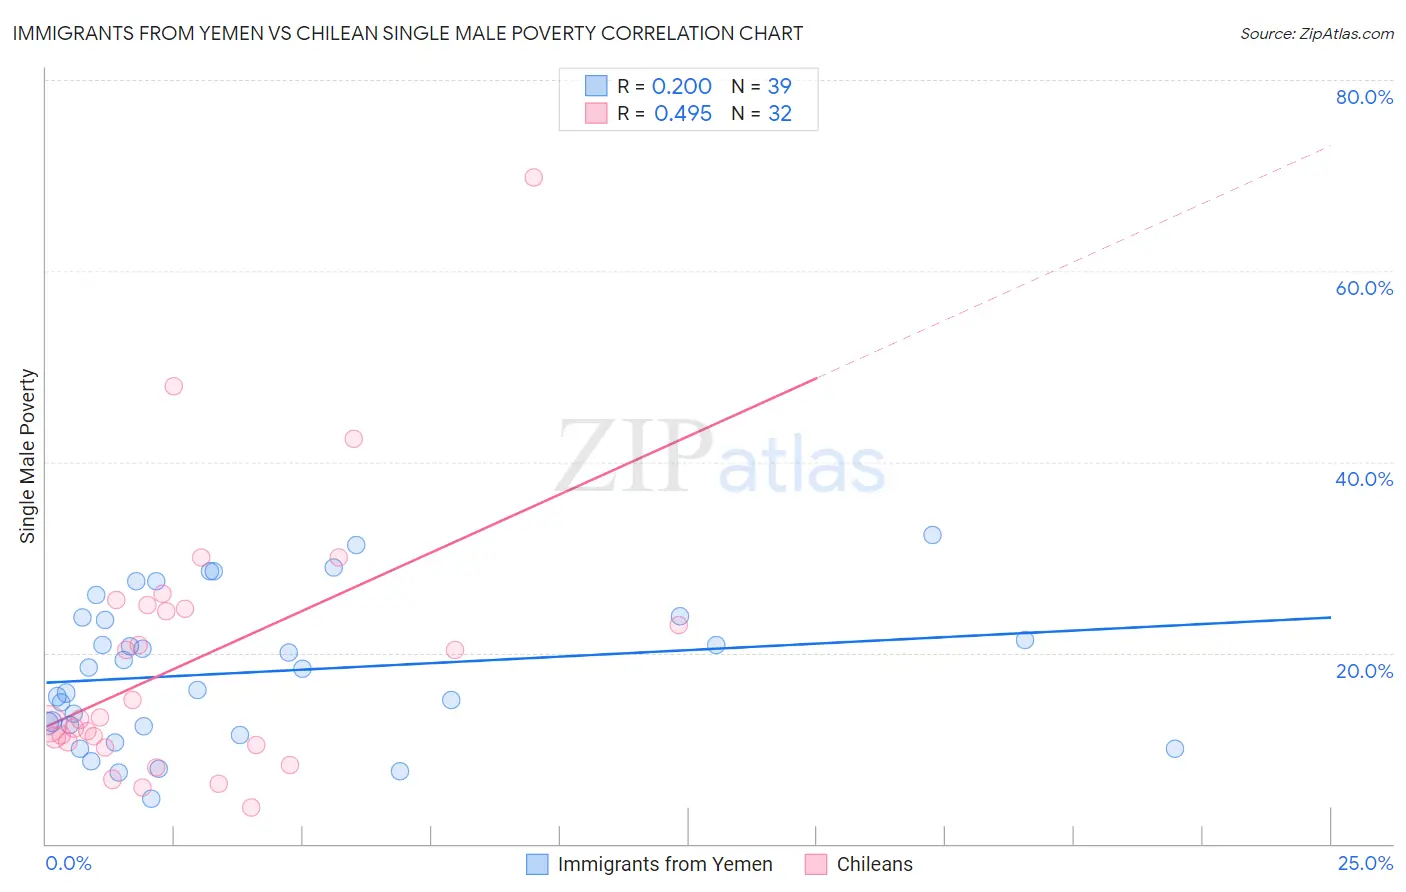
Immigrants from Yemen vs Chilean Single Male Poverty Correlation Chart
The statistical analysis conducted on geographies consisting of 80,158,341 people shows a poor positive correlation between the proportion of Immigrants from Yemen and poverty level among single males in the United States with a correlation coefficient (R) of 0.200 and weighted average of 16.9%. Similarly, the statistical analysis conducted on geographies consisting of 235,919,497 people shows a moderate positive correlation between the proportion of Chileans and poverty level among single males in the United States with a correlation coefficient (R) of 0.495 and weighted average of 11.9%, a difference of 41.5%.
Single Male Poverty Correlation Summary
| Measurement | Immigrants from Yemen | Chilean |
| Minimum | 4.7% | 3.8% |
| Maximum | 32.4% | 69.8% |
| Range | 27.7% | 66.0% |
| Mean | 18.0% | 19.1% |
| Median | 18.3% | 13.1% |
| Interquartile 25% (IQ1) | 12.3% | 10.5% |
| Interquartile 75% (IQ3) | 23.7% | 24.9% |
| Interquartile Range (IQR) | 11.4% | 14.3% |
| Standard Deviation (Sample) | 7.4% | 13.9% |
| Standard Deviation (Population) | 7.3% | 13.7% |
Similar Demographics by Single Male Poverty
Demographics Similar to Immigrants from Yemen by Single Male Poverty
In terms of single male poverty, the demographic groups most similar to Immigrants from Yemen are Creek (16.8%, a difference of 0.11%), Choctaw (17.0%, a difference of 0.72%), Shoshone (16.7%, a difference of 1.1%), Central American Indian (17.2%, a difference of 2.3%), and Osage (16.5%, a difference of 2.4%).
| Demographics | Rating | Rank | Single Male Poverty |
| Blacks/African Americans | 0.0 /100 | #317 | Tragic 16.2% |
| Chickasaw | 0.0 /100 | #318 | Tragic 16.3% |
| Chippewa | 0.0 /100 | #319 | Tragic 16.4% |
| Marshallese | 0.0 /100 | #320 | Tragic 16.4% |
| Osage | 0.0 /100 | #321 | Tragic 16.5% |
| Shoshone | 0.0 /100 | #322 | Tragic 16.7% |
| Creek | 0.0 /100 | #323 | Tragic 16.8% |
| Immigrants | Yemen | 0.0 /100 | #324 | Tragic 16.9% |
| Choctaw | 0.0 /100 | #325 | Tragic 17.0% |
| Central American Indians | 0.0 /100 | #326 | Tragic 17.2% |
| Menominee | 0.0 /100 | #327 | Tragic 17.7% |
| Kiowa | 0.0 /100 | #328 | Tragic 18.3% |
| Colville | 0.0 /100 | #329 | Tragic 18.4% |
| Cajuns | 0.0 /100 | #330 | Tragic 19.1% |
| Paiute | 0.0 /100 | #331 | Tragic 19.3% |
Demographics Similar to Chileans by Single Male Poverty
In terms of single male poverty, the demographic groups most similar to Chileans are Argentinean (11.9%, a difference of 0.060%), Immigrants from Argentina (11.9%, a difference of 0.18%), Uruguayan (11.9%, a difference of 0.19%), Immigrants from Northern Africa (11.9%, a difference of 0.22%), and Immigrants from Greece (11.9%, a difference of 0.36%).
| Demographics | Rating | Rank | Single Male Poverty |
| Immigrants | Ukraine | 99.6 /100 | #67 | Exceptional 11.9% |
| Immigrants | Croatia | 99.6 /100 | #68 | Exceptional 11.9% |
| Immigrants | Russia | 99.6 /100 | #69 | Exceptional 11.9% |
| Immigrants | Nepal | 99.6 /100 | #70 | Exceptional 11.9% |
| Immigrants | Greece | 99.6 /100 | #71 | Exceptional 11.9% |
| Immigrants | Argentina | 99.5 /100 | #72 | Exceptional 11.9% |
| Argentineans | 99.5 /100 | #73 | Exceptional 11.9% |
| Chileans | 99.5 /100 | #74 | Exceptional 11.9% |
| Uruguayans | 99.4 /100 | #75 | Exceptional 11.9% |
| Immigrants | Northern Africa | 99.4 /100 | #76 | Exceptional 11.9% |
| Immigrants | Malaysia | 99.2 /100 | #77 | Exceptional 12.0% |
| Immigrants | Venezuela | 99.1 /100 | #78 | Exceptional 12.0% |
| Immigrants | Belgium | 99.0 /100 | #79 | Exceptional 12.0% |
| Armenians | 98.7 /100 | #80 | Exceptional 12.1% |
| Immigrants | South America | 98.7 /100 | #81 | Exceptional 12.1% |