Immigrants from Western Africa vs Czech Single Male Poverty
COMPARE
Immigrants from Western Africa
Czech
Single Male Poverty
Single Male Poverty Comparison
Immigrants from Western Africa
Czechs
13.1%
SINGLE MALE POVERTY
17.6/ 100
METRIC RATING
208th/ 347
METRIC RANK
13.5%
SINGLE MALE POVERTY
1.2/ 100
METRIC RATING
248th/ 347
METRIC RANK
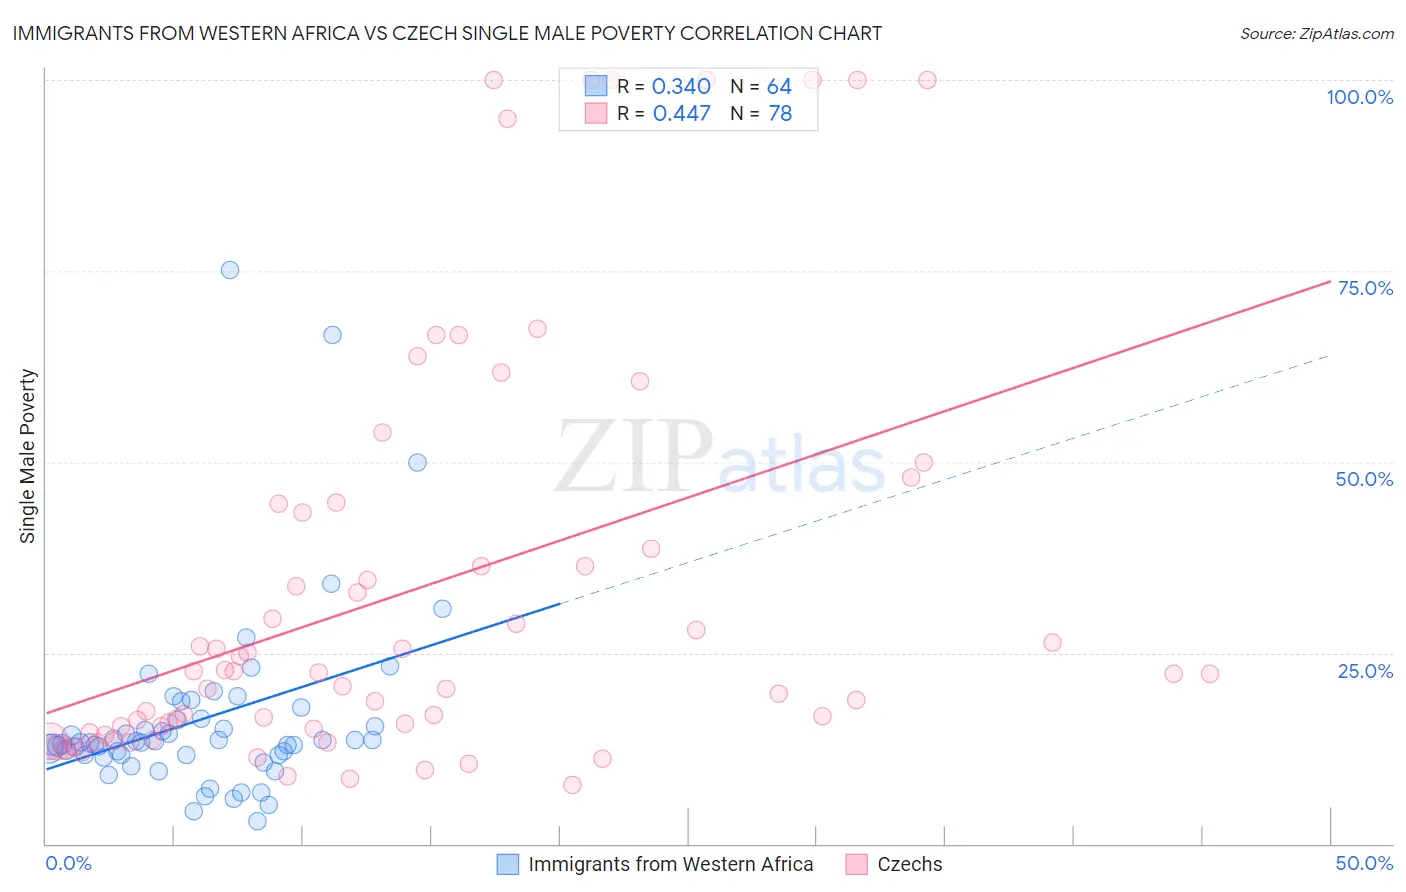
Immigrants from Western Africa vs Czech Single Male Poverty Correlation Chart
The statistical analysis conducted on geographies consisting of 322,395,283 people shows a mild positive correlation between the proportion of Immigrants from Western Africa and poverty level among single males in the United States with a correlation coefficient (R) of 0.340 and weighted average of 13.1%. Similarly, the statistical analysis conducted on geographies consisting of 410,747,171 people shows a moderate positive correlation between the proportion of Czechs and poverty level among single males in the United States with a correlation coefficient (R) of 0.447 and weighted average of 13.5%, a difference of 3.7%.
Single Male Poverty Correlation Summary
| Measurement | Immigrants from Western Africa | Czech |
| Minimum | 2.9% | 7.7% |
| Maximum | 75.2% | 100.0% |
| Range | 72.3% | 92.3% |
| Mean | 16.2% | 33.2% |
| Median | 13.2% | 22.4% |
| Interquartile 25% (IQ1) | 11.6% | 15.1% |
| Interquartile 75% (IQ3) | 16.3% | 43.3% |
| Interquartile Range (IQR) | 4.7% | 28.3% |
| Standard Deviation (Sample) | 12.3% | 27.1% |
| Standard Deviation (Population) | 12.2% | 26.9% |
Similar Demographics by Single Male Poverty
Demographics Similar to Immigrants from Western Africa by Single Male Poverty
In terms of single male poverty, the demographic groups most similar to Immigrants from Western Africa are Sudanese (13.1%, a difference of 0.010%), Mexican American Indian (13.1%, a difference of 0.010%), Immigrants from Haiti (13.1%, a difference of 0.070%), Swedish (13.1%, a difference of 0.080%), and Northern European (13.0%, a difference of 0.11%).
| Demographics | Rating | Rank | Single Male Poverty |
| Trinidadians and Tobagonians | 21.4 /100 | #201 | Fair 13.0% |
| Basques | 20.7 /100 | #202 | Fair 13.0% |
| Immigrants | Bangladesh | 20.4 /100 | #203 | Fair 13.0% |
| Estonians | 20.3 /100 | #204 | Fair 13.0% |
| Poles | 19.3 /100 | #205 | Poor 13.0% |
| Northern Europeans | 18.9 /100 | #206 | Poor 13.0% |
| Sudanese | 17.7 /100 | #207 | Poor 13.1% |
| Immigrants | Western Africa | 17.6 /100 | #208 | Poor 13.1% |
| Mexican American Indians | 17.5 /100 | #209 | Poor 13.1% |
| Immigrants | Haiti | 16.8 /100 | #210 | Poor 13.1% |
| Swedes | 16.8 /100 | #211 | Poor 13.1% |
| Senegalese | 16.4 /100 | #212 | Poor 13.1% |
| Italians | 15.9 /100 | #213 | Poor 13.1% |
| Zimbabweans | 14.9 /100 | #214 | Poor 13.1% |
| Japanese | 14.8 /100 | #215 | Poor 13.1% |
Demographics Similar to Czechs by Single Male Poverty
In terms of single male poverty, the demographic groups most similar to Czechs are Belgian (13.5%, a difference of 0.030%), Immigrants from Micronesia (13.5%, a difference of 0.040%), Immigrants from Latin America (13.5%, a difference of 0.14%), Spanish (13.6%, a difference of 0.24%), and Immigrants from Somalia (13.6%, a difference of 0.26%).
| Demographics | Rating | Rank | Single Male Poverty |
| Immigrants | Germany | 2.1 /100 | #241 | Tragic 13.4% |
| Carpatho Rusyns | 2.1 /100 | #242 | Tragic 13.4% |
| Barbadians | 2.1 /100 | #243 | Tragic 13.4% |
| Immigrants | Senegal | 1.7 /100 | #244 | Tragic 13.5% |
| Immigrants | Latin America | 1.3 /100 | #245 | Tragic 13.5% |
| Immigrants | Micronesia | 1.2 /100 | #246 | Tragic 13.5% |
| Belgians | 1.2 /100 | #247 | Tragic 13.5% |
| Czechs | 1.2 /100 | #248 | Tragic 13.5% |
| Spanish | 1.0 /100 | #249 | Tragic 13.6% |
| Immigrants | Somalia | 1.0 /100 | #250 | Tragic 13.6% |
| Immigrants | Zaire | 0.9 /100 | #251 | Tragic 13.6% |
| Finns | 0.9 /100 | #252 | Tragic 13.6% |
| German Russians | 0.8 /100 | #253 | Tragic 13.6% |
| Sub-Saharan Africans | 0.5 /100 | #254 | Tragic 13.7% |
| Spaniards | 0.4 /100 | #255 | Tragic 13.7% |