Immigrants from Western Africa vs Houma Divorced or Separated
COMPARE
Immigrants from Western Africa
Houma
Divorced or Separated
Divorced or Separated Comparison
Immigrants from Western Africa
Houma
12.3%
DIVORCED OR SEPARATED
9.3/ 100
METRIC RATING
226th/ 347
METRIC RANK
13.6%
DIVORCED OR SEPARATED
0.0/ 100
METRIC RATING
329th/ 347
METRIC RANK
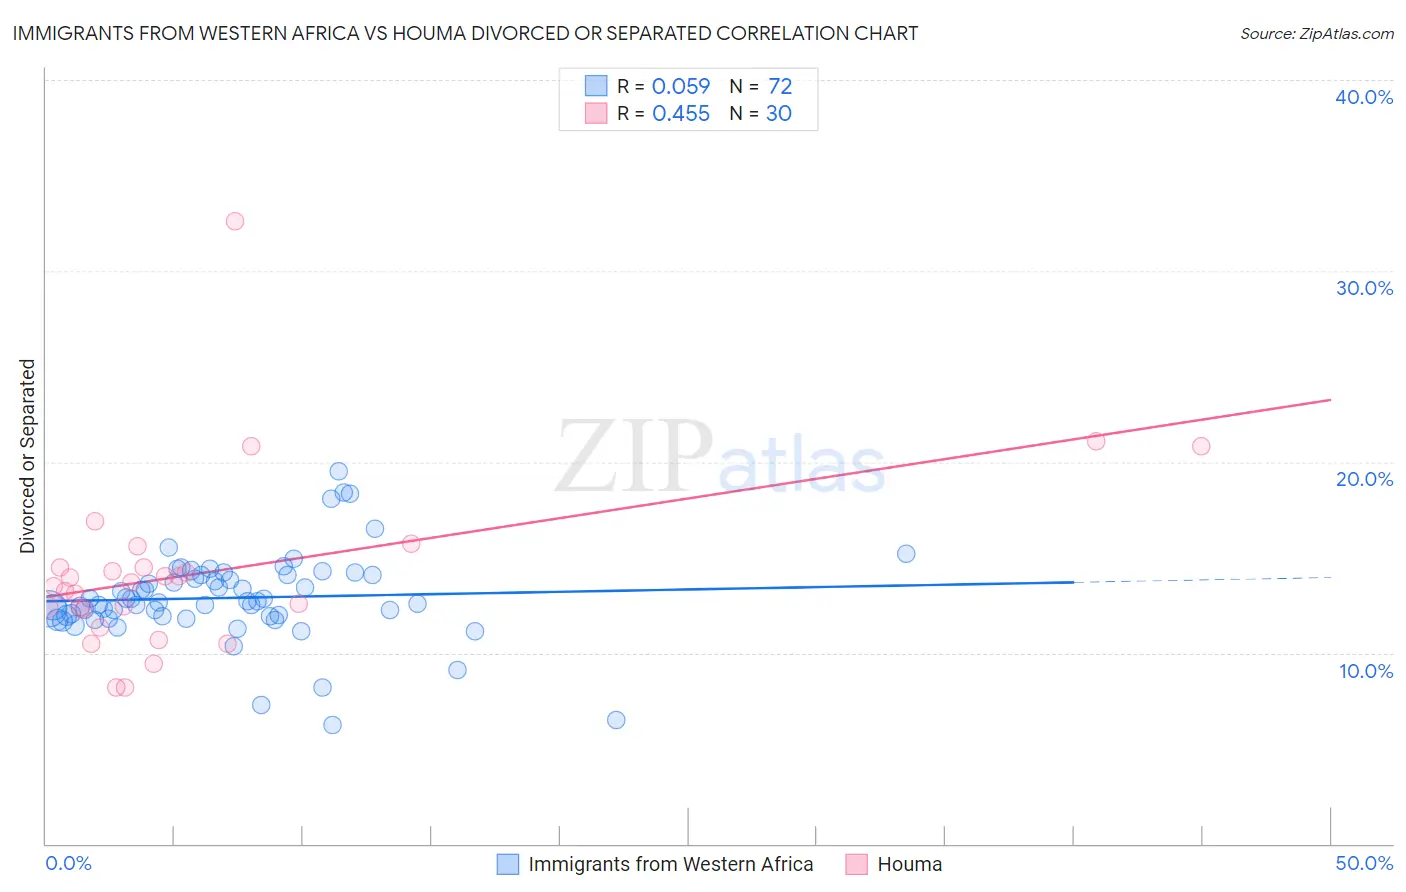
Immigrants from Western Africa vs Houma Divorced or Separated Correlation Chart
The statistical analysis conducted on geographies consisting of 357,656,491 people shows a slight positive correlation between the proportion of Immigrants from Western Africa and percentage of population currently divorced or separated in the United States with a correlation coefficient (R) of 0.059 and weighted average of 12.3%. Similarly, the statistical analysis conducted on geographies consisting of 36,793,405 people shows a moderate positive correlation between the proportion of Houma and percentage of population currently divorced or separated in the United States with a correlation coefficient (R) of 0.455 and weighted average of 13.6%, a difference of 10.6%.
Divorced or Separated Correlation Summary
| Measurement | Immigrants from Western Africa | Houma |
| Minimum | 6.2% | 8.2% |
| Maximum | 19.5% | 32.6% |
| Range | 13.3% | 24.4% |
| Mean | 12.9% | 14.2% |
| Median | 12.7% | 13.6% |
| Interquartile 25% (IQ1) | 11.9% | 12.3% |
| Interquartile 75% (IQ3) | 14.1% | 14.5% |
| Interquartile Range (IQR) | 2.2% | 2.2% |
| Standard Deviation (Sample) | 2.3% | 4.7% |
| Standard Deviation (Population) | 2.3% | 4.6% |
Similar Demographics by Divorced or Separated
Demographics Similar to Immigrants from Western Africa by Divorced or Separated
In terms of divorced or separated, the demographic groups most similar to Immigrants from Western Africa are Belgian (12.3%, a difference of 0.030%), Immigrants from the Azores (12.3%, a difference of 0.040%), Hmong (12.3%, a difference of 0.050%), Scandinavian (12.3%, a difference of 0.10%), and Immigrants from Cameroon (12.3%, a difference of 0.10%).
| Demographics | Rating | Rank | Divorced or Separated |
| Czechoslovakians | 11.7 /100 | #219 | Poor 12.3% |
| British | 11.6 /100 | #220 | Poor 12.3% |
| Guamanians/Chamorros | 11.3 /100 | #221 | Poor 12.3% |
| Bangladeshis | 10.5 /100 | #222 | Poor 12.3% |
| Scandinavians | 10.4 /100 | #223 | Poor 12.3% |
| Immigrants | Azores | 9.7 /100 | #224 | Tragic 12.3% |
| Belgians | 9.7 /100 | #225 | Tragic 12.3% |
| Immigrants | Western Africa | 9.3 /100 | #226 | Tragic 12.3% |
| Hmong | 8.8 /100 | #227 | Tragic 12.3% |
| Immigrants | Cameroon | 8.3 /100 | #228 | Tragic 12.3% |
| Immigrants | Sudan | 8.2 /100 | #229 | Tragic 12.3% |
| Yakama | 7.8 /100 | #230 | Tragic 12.3% |
| Yugoslavians | 6.6 /100 | #231 | Tragic 12.3% |
| Canadians | 5.3 /100 | #232 | Tragic 12.4% |
| Malaysians | 4.8 /100 | #233 | Tragic 12.4% |
Demographics Similar to Houma by Divorced or Separated
In terms of divorced or separated, the demographic groups most similar to Houma are Paiute (13.6%, a difference of 0.11%), Immigrants from Caribbean (13.6%, a difference of 0.15%), Black/African American (13.6%, a difference of 0.24%), Comanche (13.5%, a difference of 0.53%), and Cherokee (13.7%, a difference of 1.0%).
| Demographics | Rating | Rank | Divorced or Separated |
| Immigrants | Haiti | 0.0 /100 | #322 | Tragic 13.4% |
| U.S. Virgin Islanders | 0.0 /100 | #323 | Tragic 13.4% |
| Osage | 0.0 /100 | #324 | Tragic 13.4% |
| Potawatomi | 0.0 /100 | #325 | Tragic 13.5% |
| Immigrants | Congo | 0.0 /100 | #326 | Tragic 13.5% |
| Comanche | 0.0 /100 | #327 | Tragic 13.5% |
| Immigrants | Caribbean | 0.0 /100 | #328 | Tragic 13.6% |
| Houma | 0.0 /100 | #329 | Tragic 13.6% |
| Paiute | 0.0 /100 | #330 | Tragic 13.6% |
| Blacks/African Americans | 0.0 /100 | #331 | Tragic 13.6% |
| Cherokee | 0.0 /100 | #332 | Tragic 13.7% |
| Puerto Ricans | 0.0 /100 | #333 | Tragic 13.9% |
| Immigrants | Bahamas | 0.0 /100 | #334 | Tragic 13.9% |
| Dutch West Indians | 0.0 /100 | #335 | Tragic 14.0% |
| Shoshone | 0.0 /100 | #336 | Tragic 14.0% |