Immigrants from Uganda vs Yakama 7th Grade
COMPARE
Immigrants from Uganda
Yakama
7th Grade
7th Grade Comparison
Immigrants from Uganda
Yakama
96.0%
7TH GRADE
36.0/ 100
METRIC RATING
187th/ 347
METRIC RANK
91.7%
7TH GRADE
0.0/ 100
METRIC RATING
340th/ 347
METRIC RANK
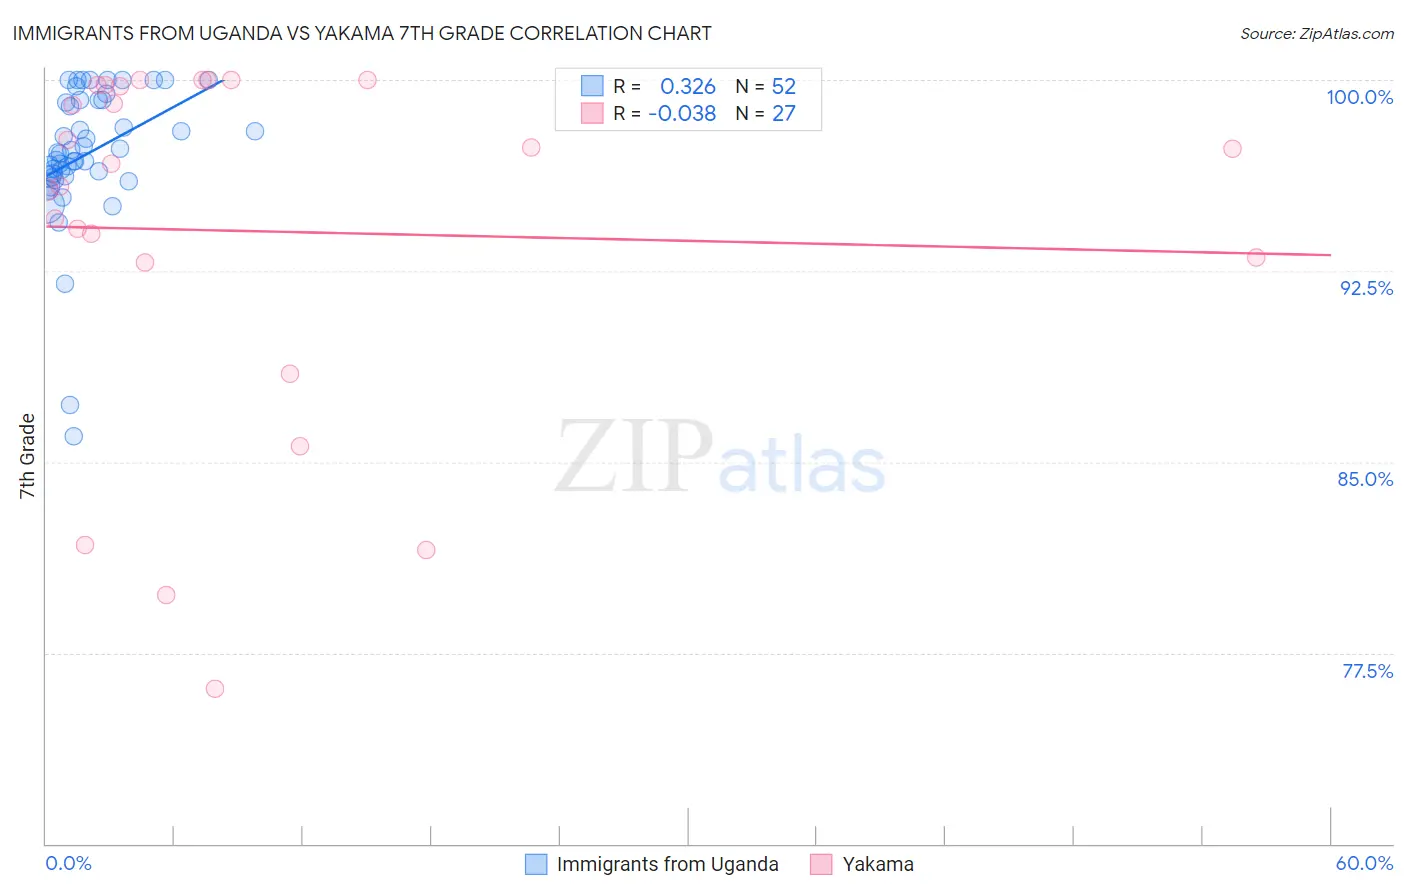
Immigrants from Uganda vs Yakama 7th Grade Correlation Chart
The statistical analysis conducted on geographies consisting of 125,943,496 people shows a mild positive correlation between the proportion of Immigrants from Uganda and percentage of population with at least 7th grade education in the United States with a correlation coefficient (R) of 0.326 and weighted average of 96.0%. Similarly, the statistical analysis conducted on geographies consisting of 19,923,144 people shows no correlation between the proportion of Yakama and percentage of population with at least 7th grade education in the United States with a correlation coefficient (R) of -0.038 and weighted average of 91.7%, a difference of 4.6%.
7th Grade Correlation Summary
| Measurement | Immigrants from Uganda | Yakama |
| Minimum | 86.0% | 76.1% |
| Maximum | 100.0% | 100.0% |
| Range | 14.0% | 23.9% |
| Mean | 97.1% | 94.1% |
| Median | 97.1% | 96.7% |
| Interquartile 25% (IQ1) | 96.2% | 92.8% |
| Interquartile 75% (IQ3) | 99.2% | 99.8% |
| Interquartile Range (IQR) | 3.0% | 6.9% |
| Standard Deviation (Sample) | 2.8% | 7.1% |
| Standard Deviation (Population) | 2.7% | 7.0% |
Similar Demographics by 7th Grade
Demographics Similar to Immigrants from Uganda by 7th Grade
In terms of 7th grade, the demographic groups most similar to Immigrants from Uganda are Immigrants from Iraq (96.0%, a difference of 0.0%), Sierra Leonean (96.0%, a difference of 0.010%), Brazilian (96.0%, a difference of 0.010%), Immigrants from Egypt (95.9%, a difference of 0.010%), and Immigrants from Venezuela (95.9%, a difference of 0.010%).
| Demographics | Rating | Rank | 7th Grade |
| Immigrants | Brazil | 46.8 /100 | #180 | Average 96.0% |
| Pakistanis | 44.5 /100 | #181 | Average 96.0% |
| Iraqis | 41.2 /100 | #182 | Average 96.0% |
| Immigrants | Spain | 38.8 /100 | #183 | Fair 96.0% |
| Sierra Leoneans | 37.5 /100 | #184 | Fair 96.0% |
| Brazilians | 37.3 /100 | #185 | Fair 96.0% |
| Immigrants | Iraq | 36.1 /100 | #186 | Fair 96.0% |
| Immigrants | Uganda | 36.0 /100 | #187 | Fair 96.0% |
| Immigrants | Egypt | 34.3 /100 | #188 | Fair 95.9% |
| Immigrants | Venezuela | 33.9 /100 | #189 | Fair 95.9% |
| Immigrants | Micronesia | 32.6 /100 | #190 | Fair 95.9% |
| Liberians | 32.5 /100 | #191 | Fair 95.9% |
| Panamanians | 32.3 /100 | #192 | Fair 95.9% |
| Immigrants | Bahamas | 30.8 /100 | #193 | Fair 95.9% |
| Immigrants | Nepal | 30.0 /100 | #194 | Fair 95.9% |
Demographics Similar to Yakama by 7th Grade
In terms of 7th grade, the demographic groups most similar to Yakama are Guatemalan (91.7%, a difference of 0.020%), Mexican (91.9%, a difference of 0.20%), Salvadoran (91.5%, a difference of 0.29%), Central American (92.1%, a difference of 0.44%), and Immigrants from Guatemala (91.3%, a difference of 0.45%).
| Demographics | Rating | Rank | 7th Grade |
| Immigrants | Armenia | 0.0 /100 | #333 | Tragic 92.7% |
| Immigrants | Yemen | 0.0 /100 | #334 | Tragic 92.6% |
| Mexican American Indians | 0.0 /100 | #335 | Tragic 92.6% |
| Immigrants | Honduras | 0.0 /100 | #336 | Tragic 92.5% |
| Immigrants | Latin America | 0.0 /100 | #337 | Tragic 92.2% |
| Central Americans | 0.0 /100 | #338 | Tragic 92.1% |
| Mexicans | 0.0 /100 | #339 | Tragic 91.9% |
| Yakama | 0.0 /100 | #340 | Tragic 91.7% |
| Guatemalans | 0.0 /100 | #341 | Tragic 91.7% |
| Salvadorans | 0.0 /100 | #342 | Tragic 91.5% |
| Immigrants | Guatemala | 0.0 /100 | #343 | Tragic 91.3% |
| Immigrants | Central America | 0.0 /100 | #344 | Tragic 91.0% |
| Immigrants | El Salvador | 0.0 /100 | #345 | Tragic 90.9% |
| Immigrants | Mexico | 0.0 /100 | #346 | Tragic 90.7% |
| Spanish American Indians | 0.0 /100 | #347 | Tragic 90.3% |