Immigrants from Uganda vs Alsatian Male Poverty
COMPARE
Immigrants from Uganda
Alsatian
Male Poverty
Male Poverty Comparison
Immigrants from Uganda
Alsatians
11.8%
MALE POVERTY
8.5/ 100
METRIC RATING
204th/ 347
METRIC RANK
12.4%
MALE POVERTY
1.3/ 100
METRIC RATING
228th/ 347
METRIC RANK
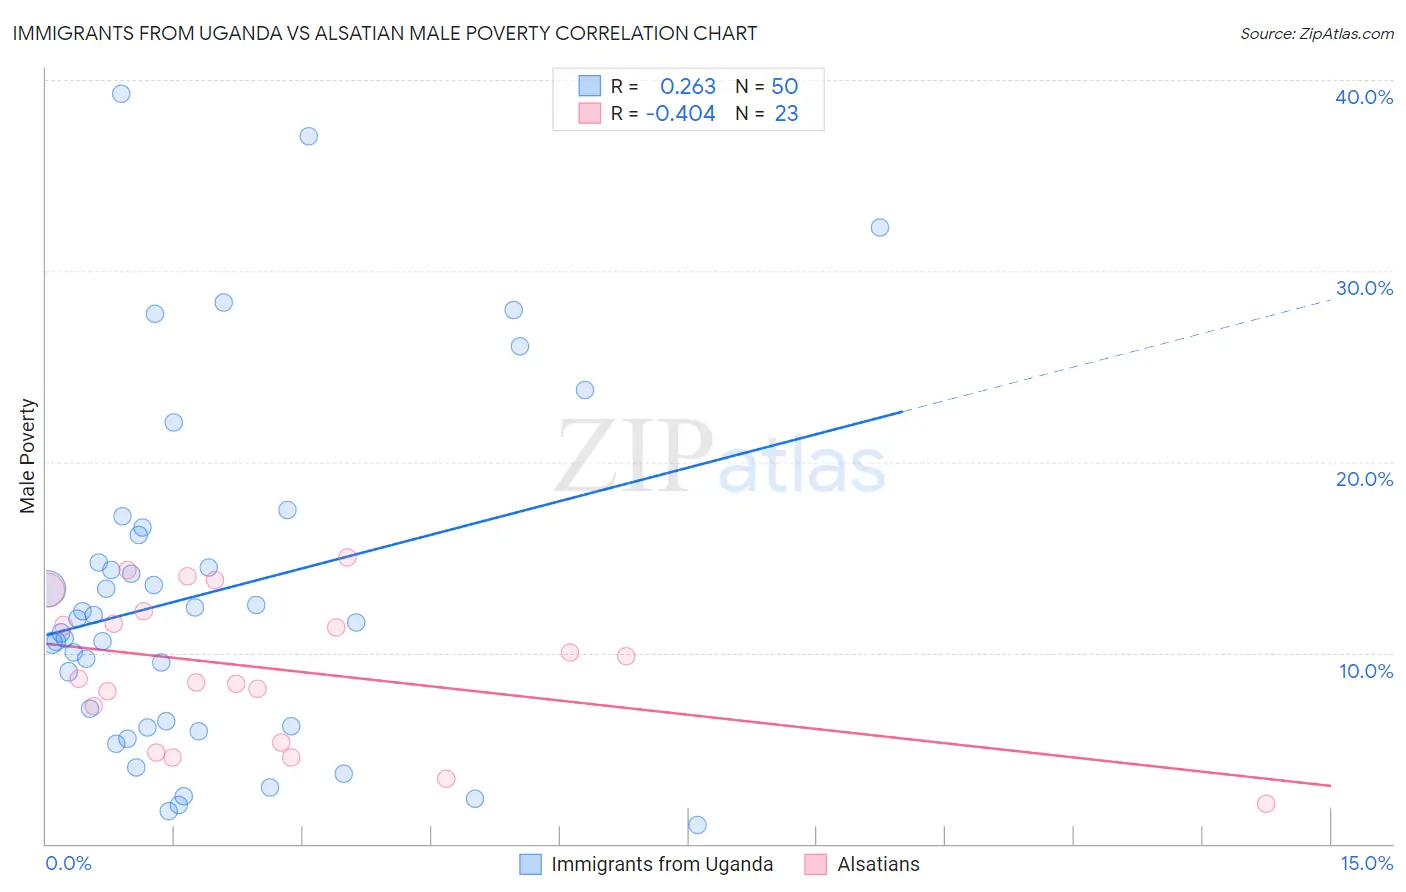
Immigrants from Uganda vs Alsatian Male Poverty Correlation Chart
The statistical analysis conducted on geographies consisting of 125,960,451 people shows a weak positive correlation between the proportion of Immigrants from Uganda and poverty level among males in the United States with a correlation coefficient (R) of 0.263 and weighted average of 11.8%. Similarly, the statistical analysis conducted on geographies consisting of 82,673,926 people shows a moderate negative correlation between the proportion of Alsatians and poverty level among males in the United States with a correlation coefficient (R) of -0.404 and weighted average of 12.4%, a difference of 4.4%.
Male Poverty Correlation Summary
| Measurement | Immigrants from Uganda | Alsatian |
| Minimum | 0.96% | 2.1% |
| Maximum | 39.3% | 15.0% |
| Range | 38.3% | 12.9% |
| Mean | 13.1% | 9.1% |
| Median | 11.7% | 8.6% |
| Interquartile 25% (IQ1) | 6.2% | 5.3% |
| Interquartile 75% (IQ3) | 16.2% | 12.2% |
| Interquartile Range (IQR) | 10.0% | 6.9% |
| Standard Deviation (Sample) | 9.1% | 3.8% |
| Standard Deviation (Population) | 9.0% | 3.7% |
Similar Demographics by Male Poverty
Demographics Similar to Immigrants from Uganda by Male Poverty
In terms of male poverty, the demographic groups most similar to Immigrants from Uganda are Immigrants from Western Asia (11.8%, a difference of 0.36%), Aleut (11.8%, a difference of 0.50%), Panamanian (11.9%, a difference of 0.78%), Immigrants from Eastern Africa (12.0%, a difference of 1.1%), and Spaniard (11.7%, a difference of 1.2%).
| Demographics | Rating | Rank | Male Poverty |
| Delaware | 15.4 /100 | #197 | Poor 11.7% |
| Iraqis | 14.7 /100 | #198 | Poor 11.7% |
| Spanish | 14.1 /100 | #199 | Poor 11.7% |
| Immigrants | Lebanon | 13.6 /100 | #200 | Poor 11.7% |
| Spaniards | 13.5 /100 | #201 | Poor 11.7% |
| Aleuts | 10.4 /100 | #202 | Poor 11.8% |
| Immigrants | Western Asia | 9.8 /100 | #203 | Tragic 11.8% |
| Immigrants | Uganda | 8.5 /100 | #204 | Tragic 11.8% |
| Panamanians | 6.2 /100 | #205 | Tragic 11.9% |
| Immigrants | Eastern Africa | 5.4 /100 | #206 | Tragic 12.0% |
| Malaysians | 5.2 /100 | #207 | Tragic 12.0% |
| Immigrants | Immigrants | 4.5 /100 | #208 | Tragic 12.0% |
| Immigrants | Azores | 4.3 /100 | #209 | Tragic 12.0% |
| Moroccans | 4.2 /100 | #210 | Tragic 12.0% |
| Immigrants | Panama | 4.0 /100 | #211 | Tragic 12.1% |
Demographics Similar to Alsatians by Male Poverty
In terms of male poverty, the demographic groups most similar to Alsatians are Alaska Native (12.4%, a difference of 0.040%), Cuban (12.4%, a difference of 0.090%), Nigerian (12.3%, a difference of 0.13%), Osage (12.3%, a difference of 0.30%), and Immigrants from Nigeria (12.3%, a difference of 0.36%).
| Demographics | Rating | Rank | Male Poverty |
| Ugandans | 2.2 /100 | #221 | Tragic 12.2% |
| Immigrants | Africa | 2.1 /100 | #222 | Tragic 12.2% |
| Immigrants | Micronesia | 2.1 /100 | #223 | Tragic 12.2% |
| Immigrants | Nigeria | 1.6 /100 | #224 | Tragic 12.3% |
| Osage | 1.5 /100 | #225 | Tragic 12.3% |
| Nigerians | 1.4 /100 | #226 | Tragic 12.3% |
| Alaska Natives | 1.4 /100 | #227 | Tragic 12.4% |
| Alsatians | 1.3 /100 | #228 | Tragic 12.4% |
| Cubans | 1.3 /100 | #229 | Tragic 12.4% |
| Marshallese | 0.8 /100 | #230 | Tragic 12.5% |
| Salvadorans | 0.6 /100 | #231 | Tragic 12.6% |
| Nicaraguans | 0.6 /100 | #232 | Tragic 12.6% |
| Fijians | 0.6 /100 | #233 | Tragic 12.6% |
| Immigrants | Armenia | 0.6 /100 | #234 | Tragic 12.6% |
| Immigrants | Laos | 0.5 /100 | #235 | Tragic 12.6% |