Immigrants from Uganda vs Yakama 12th Grade, No Diploma
COMPARE
Immigrants from Uganda
Yakama
12th Grade, No Diploma
12th Grade, No Diploma Comparison
Immigrants from Uganda
Yakama
90.9%
12TH GRADE, NO DIPLOMA
31.6/ 100
METRIC RATING
189th/ 347
METRIC RANK
82.5%
12TH GRADE, NO DIPLOMA
0.0/ 100
METRIC RATING
346th/ 347
METRIC RANK
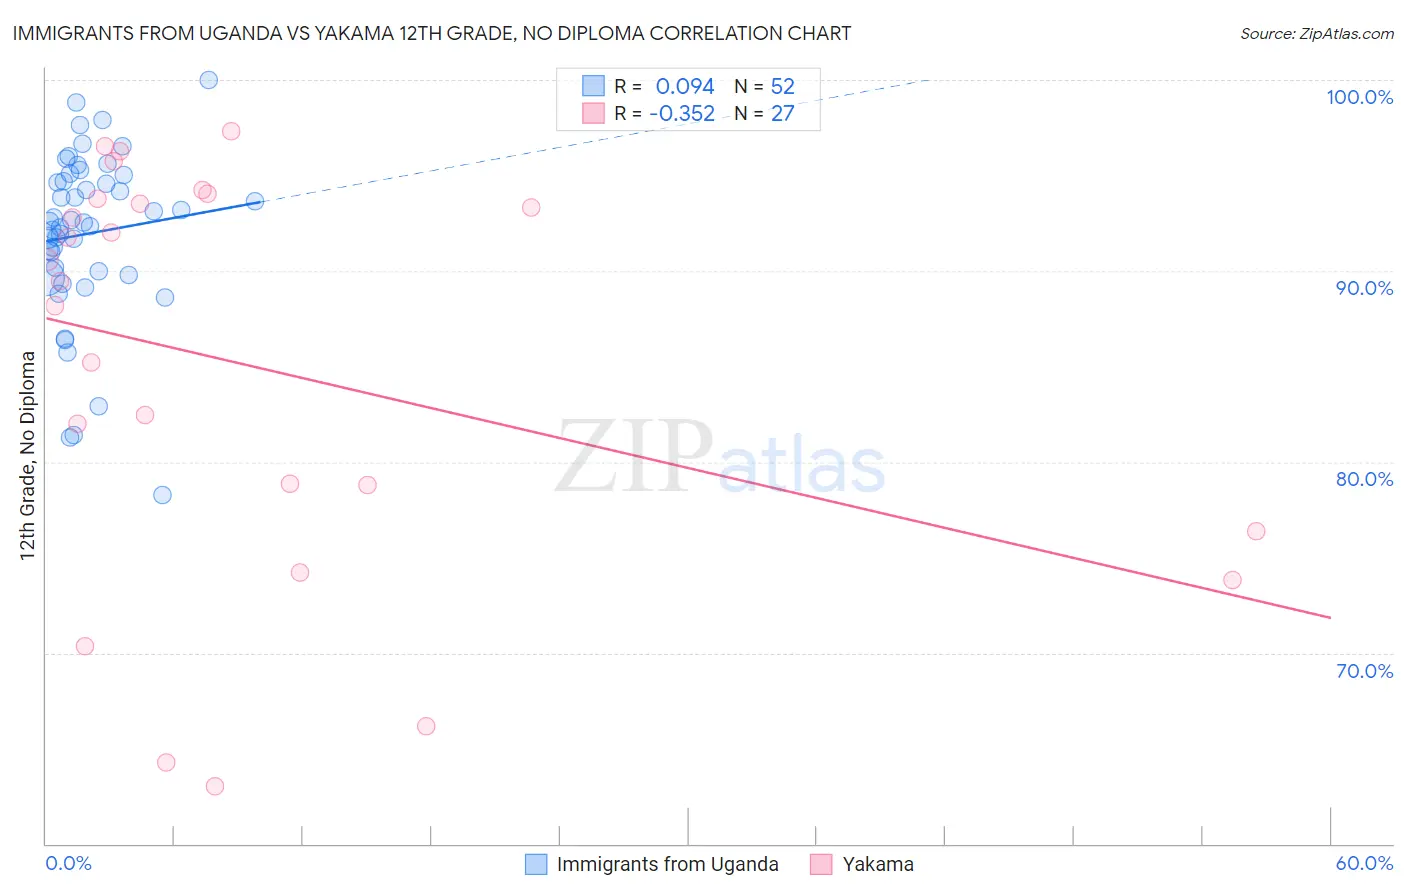
Immigrants from Uganda vs Yakama 12th Grade, No Diploma Correlation Chart
The statistical analysis conducted on geographies consisting of 125,969,169 people shows a slight positive correlation between the proportion of Immigrants from Uganda and percentage of population with at least 12th grade (no diploma) education in the United States with a correlation coefficient (R) of 0.094 and weighted average of 90.9%. Similarly, the statistical analysis conducted on geographies consisting of 19,923,144 people shows a mild negative correlation between the proportion of Yakama and percentage of population with at least 12th grade (no diploma) education in the United States with a correlation coefficient (R) of -0.352 and weighted average of 82.5%, a difference of 10.3%.
12th Grade, No Diploma Correlation Summary
| Measurement | Immigrants from Uganda | Yakama |
| Minimum | 78.2% | 63.0% |
| Maximum | 100.0% | 97.3% |
| Range | 21.8% | 34.3% |
| Mean | 92.0% | 85.0% |
| Median | 92.6% | 89.4% |
| Interquartile 25% (IQ1) | 89.9% | 76.4% |
| Interquartile 75% (IQ3) | 94.9% | 93.8% |
| Interquartile Range (IQR) | 5.0% | 17.4% |
| Standard Deviation (Sample) | 4.4% | 10.8% |
| Standard Deviation (Population) | 4.4% | 10.6% |
Similar Demographics by 12th Grade, No Diploma
Demographics Similar to Immigrants from Uganda by 12th Grade, No Diploma
In terms of 12th grade, no diploma, the demographic groups most similar to Immigrants from Uganda are American (91.0%, a difference of 0.010%), Potawatomi (91.0%, a difference of 0.020%), Ethiopian (91.0%, a difference of 0.030%), Afghan (90.9%, a difference of 0.030%), and Sudanese (91.0%, a difference of 0.040%).
| Demographics | Rating | Rank | 12th Grade, No Diploma |
| Immigrants | Nonimmigrants | 38.8 /100 | #182 | Fair 91.0% |
| Osage | 38.3 /100 | #183 | Fair 91.0% |
| Spaniards | 36.2 /100 | #184 | Fair 91.0% |
| Sudanese | 34.4 /100 | #185 | Fair 91.0% |
| Ethiopians | 33.9 /100 | #186 | Fair 91.0% |
| Potawatomi | 32.9 /100 | #187 | Fair 91.0% |
| Americans | 32.6 /100 | #188 | Fair 91.0% |
| Immigrants | Uganda | 31.6 /100 | #189 | Fair 90.9% |
| Afghans | 29.9 /100 | #190 | Fair 90.9% |
| Moroccans | 28.8 /100 | #191 | Fair 90.9% |
| Immigrants | Eastern Africa | 27.7 /100 | #192 | Fair 90.9% |
| Immigrants | Ethiopia | 27.2 /100 | #193 | Fair 90.9% |
| Immigrants | Oceania | 26.0 /100 | #194 | Fair 90.9% |
| Koreans | 24.5 /100 | #195 | Fair 90.8% |
| Panamanians | 22.8 /100 | #196 | Fair 90.8% |
Demographics Similar to Yakama by 12th Grade, No Diploma
In terms of 12th grade, no diploma, the demographic groups most similar to Yakama are Immigrants from Mexico (82.4%, a difference of 0.040%), Spanish American Indian (82.9%, a difference of 0.53%), Immigrants from Central America (83.0%, a difference of 0.60%), Immigrants from El Salvador (83.6%, a difference of 1.3%), and Houma (83.7%, a difference of 1.5%).
| Demographics | Rating | Rank | 12th Grade, No Diploma |
| Immigrants | Latin America | 0.0 /100 | #333 | Tragic 85.0% |
| Immigrants | Dominican Republic | 0.0 /100 | #334 | Tragic 84.9% |
| Immigrants | Yemen | 0.0 /100 | #335 | Tragic 84.8% |
| Tohono O'odham | 0.0 /100 | #336 | Tragic 84.7% |
| Pima | 0.0 /100 | #337 | Tragic 84.6% |
| Guatemalans | 0.0 /100 | #338 | Tragic 84.6% |
| Salvadorans | 0.0 /100 | #339 | Tragic 84.5% |
| Mexicans | 0.0 /100 | #340 | Tragic 84.1% |
| Immigrants | Guatemala | 0.0 /100 | #341 | Tragic 84.0% |
| Houma | 0.0 /100 | #342 | Tragic 83.7% |
| Immigrants | El Salvador | 0.0 /100 | #343 | Tragic 83.6% |
| Immigrants | Central America | 0.0 /100 | #344 | Tragic 83.0% |
| Spanish American Indians | 0.0 /100 | #345 | Tragic 82.9% |
| Yakama | 0.0 /100 | #346 | Tragic 82.5% |
| Immigrants | Mexico | 0.0 /100 | #347 | Tragic 82.4% |