Immigrants from Uganda vs Immigrants from Haiti Male Poverty
COMPARE
Immigrants from Uganda
Immigrants from Haiti
Male Poverty
Male Poverty Comparison
Immigrants from Uganda
Immigrants from Haiti
11.8%
MALE POVERTY
8.5/ 100
METRIC RATING
204th/ 347
METRIC RANK
13.8%
MALE POVERTY
0.0/ 100
METRIC RATING
284th/ 347
METRIC RANK
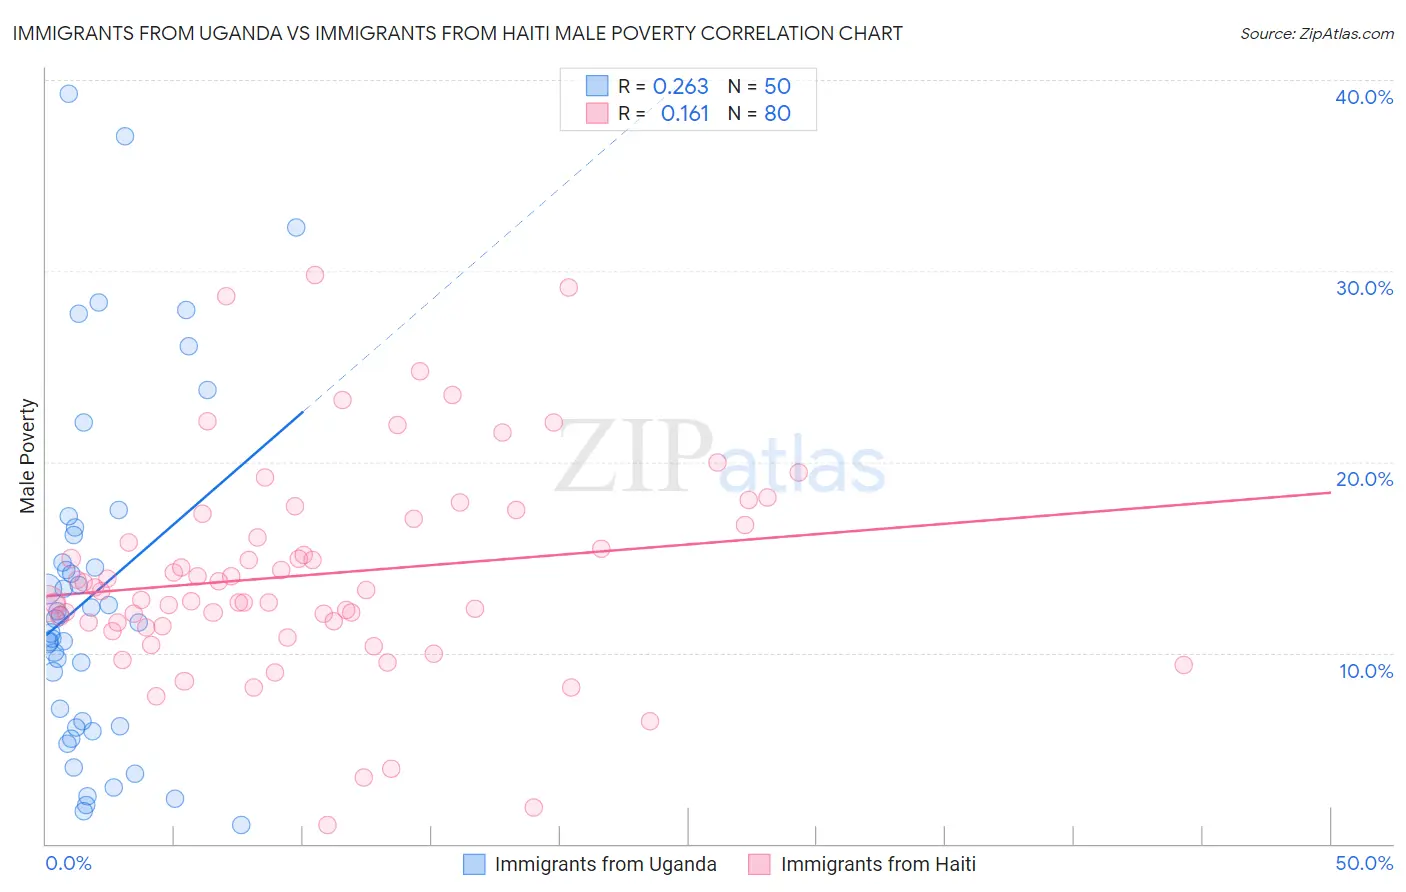
Immigrants from Uganda vs Immigrants from Haiti Male Poverty Correlation Chart
The statistical analysis conducted on geographies consisting of 125,960,451 people shows a weak positive correlation between the proportion of Immigrants from Uganda and poverty level among males in the United States with a correlation coefficient (R) of 0.263 and weighted average of 11.8%. Similarly, the statistical analysis conducted on geographies consisting of 225,134,025 people shows a poor positive correlation between the proportion of Immigrants from Haiti and poverty level among males in the United States with a correlation coefficient (R) of 0.161 and weighted average of 13.8%, a difference of 16.2%.
Male Poverty Correlation Summary
| Measurement | Immigrants from Uganda | Immigrants from Haiti |
| Minimum | 0.96% | 0.99% |
| Maximum | 39.3% | 29.8% |
| Range | 38.3% | 28.8% |
| Mean | 13.1% | 14.1% |
| Median | 11.7% | 13.3% |
| Interquartile 25% (IQ1) | 6.2% | 11.5% |
| Interquartile 75% (IQ3) | 16.2% | 16.9% |
| Interquartile Range (IQR) | 10.0% | 5.4% |
| Standard Deviation (Sample) | 9.1% | 5.5% |
| Standard Deviation (Population) | 9.0% | 5.5% |
Similar Demographics by Male Poverty
Demographics Similar to Immigrants from Uganda by Male Poverty
In terms of male poverty, the demographic groups most similar to Immigrants from Uganda are Immigrants from Western Asia (11.8%, a difference of 0.36%), Aleut (11.8%, a difference of 0.50%), Panamanian (11.9%, a difference of 0.78%), Immigrants from Eastern Africa (12.0%, a difference of 1.1%), and Spaniard (11.7%, a difference of 1.2%).
| Demographics | Rating | Rank | Male Poverty |
| Delaware | 15.4 /100 | #197 | Poor 11.7% |
| Iraqis | 14.7 /100 | #198 | Poor 11.7% |
| Spanish | 14.1 /100 | #199 | Poor 11.7% |
| Immigrants | Lebanon | 13.6 /100 | #200 | Poor 11.7% |
| Spaniards | 13.5 /100 | #201 | Poor 11.7% |
| Aleuts | 10.4 /100 | #202 | Poor 11.8% |
| Immigrants | Western Asia | 9.8 /100 | #203 | Tragic 11.8% |
| Immigrants | Uganda | 8.5 /100 | #204 | Tragic 11.8% |
| Panamanians | 6.2 /100 | #205 | Tragic 11.9% |
| Immigrants | Eastern Africa | 5.4 /100 | #206 | Tragic 12.0% |
| Malaysians | 5.2 /100 | #207 | Tragic 12.0% |
| Immigrants | Immigrants | 4.5 /100 | #208 | Tragic 12.0% |
| Immigrants | Azores | 4.3 /100 | #209 | Tragic 12.0% |
| Moroccans | 4.2 /100 | #210 | Tragic 12.0% |
| Immigrants | Panama | 4.0 /100 | #211 | Tragic 12.1% |
Demographics Similar to Immigrants from Haiti by Male Poverty
In terms of male poverty, the demographic groups most similar to Immigrants from Haiti are Comanche (13.8%, a difference of 0.010%), West Indian (13.8%, a difference of 0.010%), Shoshone (13.8%, a difference of 0.040%), Immigrants from Barbados (13.8%, a difference of 0.060%), and Immigrants from Cabo Verde (13.7%, a difference of 0.21%).
| Demographics | Rating | Rank | Male Poverty |
| Bangladeshis | 0.0 /100 | #277 | Tragic 13.6% |
| Belizeans | 0.0 /100 | #278 | Tragic 13.6% |
| Haitians | 0.0 /100 | #279 | Tragic 13.7% |
| Mexicans | 0.0 /100 | #280 | Tragic 13.7% |
| Yaqui | 0.0 /100 | #281 | Tragic 13.7% |
| Immigrants | Cabo Verde | 0.0 /100 | #282 | Tragic 13.7% |
| Comanche | 0.0 /100 | #283 | Tragic 13.8% |
| Immigrants | Haiti | 0.0 /100 | #284 | Tragic 13.8% |
| West Indians | 0.0 /100 | #285 | Tragic 13.8% |
| Shoshone | 0.0 /100 | #286 | Tragic 13.8% |
| Immigrants | Barbados | 0.0 /100 | #287 | Tragic 13.8% |
| Immigrants | St. Vincent and the Grenadines | 0.0 /100 | #288 | Tragic 13.8% |
| Guatemalans | 0.0 /100 | #289 | Tragic 13.8% |
| Immigrants | Zaire | 0.0 /100 | #290 | Tragic 13.8% |
| Vietnamese | 0.0 /100 | #291 | Tragic 13.8% |