Croatian vs Cherokee Male Poverty
COMPARE
Croatian
Cherokee
Male Poverty
Male Poverty Comparison
Croatians
Cherokee
9.6%
MALE POVERTY
99.7/ 100
METRIC RATING
22nd/ 347
METRIC RANK
13.1%
MALE POVERTY
0.1/ 100
METRIC RATING
259th/ 347
METRIC RANK
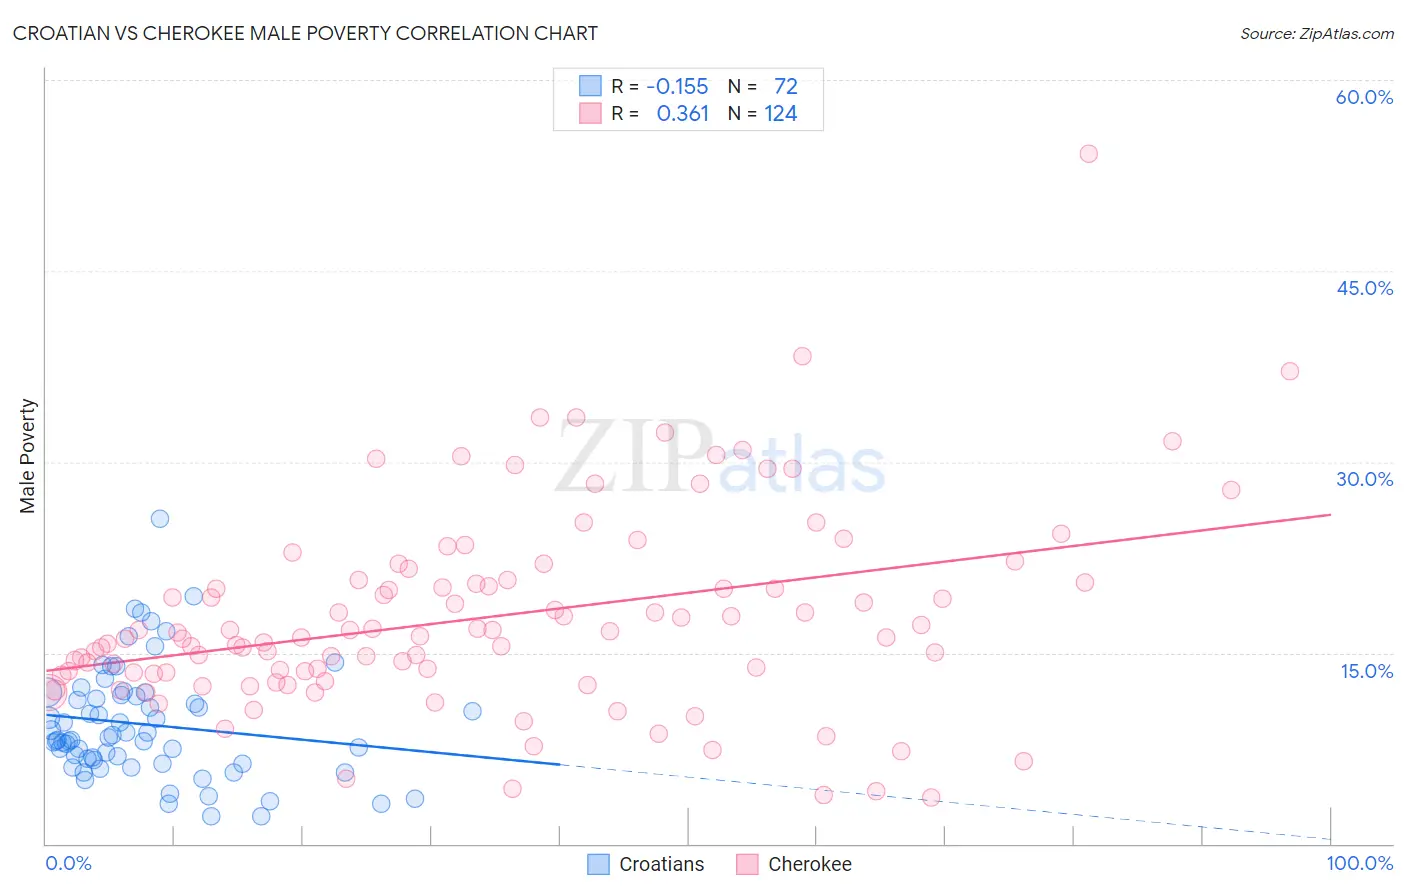
Croatian vs Cherokee Male Poverty Correlation Chart
The statistical analysis conducted on geographies consisting of 375,378,387 people shows a poor negative correlation between the proportion of Croatians and poverty level among males in the United States with a correlation coefficient (R) of -0.155 and weighted average of 9.6%. Similarly, the statistical analysis conducted on geographies consisting of 493,122,545 people shows a mild positive correlation between the proportion of Cherokee and poverty level among males in the United States with a correlation coefficient (R) of 0.361 and weighted average of 13.1%, a difference of 36.1%.
Male Poverty Correlation Summary
| Measurement | Croatian | Cherokee |
| Minimum | 2.1% | 3.6% |
| Maximum | 25.5% | 54.2% |
| Range | 23.4% | 50.6% |
| Mean | 9.4% | 17.8% |
| Median | 8.2% | 16.3% |
| Interquartile 25% (IQ1) | 6.5% | 13.4% |
| Interquartile 75% (IQ3) | 11.6% | 20.6% |
| Interquartile Range (IQR) | 5.2% | 7.2% |
| Standard Deviation (Sample) | 4.4% | 7.8% |
| Standard Deviation (Population) | 4.4% | 7.8% |
Similar Demographics by Male Poverty
Demographics Similar to Croatians by Male Poverty
In terms of male poverty, the demographic groups most similar to Croatians are Italian (9.6%, a difference of 0.010%), Swedish (9.6%, a difference of 0.090%), Eastern European (9.6%, a difference of 0.23%), Immigrants from Scotland (9.6%, a difference of 0.25%), and Latvian (9.6%, a difference of 0.51%).
| Demographics | Rating | Rank | Male Poverty |
| Bhutanese | 99.8 /100 | #15 | Exceptional 9.5% |
| Luxembourgers | 99.8 /100 | #16 | Exceptional 9.5% |
| Norwegians | 99.8 /100 | #17 | Exceptional 9.5% |
| Lithuanians | 99.8 /100 | #18 | Exceptional 9.5% |
| Immigrants | Hong Kong | 99.7 /100 | #19 | Exceptional 9.6% |
| Latvians | 99.7 /100 | #20 | Exceptional 9.6% |
| Immigrants | Scotland | 99.7 /100 | #21 | Exceptional 9.6% |
| Croatians | 99.7 /100 | #22 | Exceptional 9.6% |
| Italians | 99.7 /100 | #23 | Exceptional 9.6% |
| Swedes | 99.7 /100 | #24 | Exceptional 9.6% |
| Eastern Europeans | 99.6 /100 | #25 | Exceptional 9.6% |
| Burmese | 99.6 /100 | #26 | Exceptional 9.7% |
| Danes | 99.6 /100 | #27 | Exceptional 9.7% |
| Immigrants | Korea | 99.6 /100 | #28 | Exceptional 9.7% |
| Greeks | 99.6 /100 | #29 | Exceptional 9.7% |
Demographics Similar to Cherokee by Male Poverty
In terms of male poverty, the demographic groups most similar to Cherokee are Ottawa (13.1%, a difference of 0.11%), Trinidadian and Tobagonian (13.1%, a difference of 0.13%), Cape Verdean (13.1%, a difference of 0.16%), Spanish American Indian (13.1%, a difference of 0.18%), and Immigrants from Trinidad and Tobago (13.1%, a difference of 0.29%).
| Demographics | Rating | Rank | Male Poverty |
| Immigrants | Ecuador | 0.2 /100 | #252 | Tragic 12.9% |
| Immigrants | Ghana | 0.2 /100 | #253 | Tragic 12.9% |
| Mexican American Indians | 0.1 /100 | #254 | Tragic 13.0% |
| Immigrants | Liberia | 0.1 /100 | #255 | Tragic 13.0% |
| Immigrants | Burma/Myanmar | 0.1 /100 | #256 | Tragic 13.0% |
| Immigrants | Trinidad and Tobago | 0.1 /100 | #257 | Tragic 13.1% |
| Cape Verdeans | 0.1 /100 | #258 | Tragic 13.1% |
| Cherokee | 0.1 /100 | #259 | Tragic 13.1% |
| Ottawa | 0.1 /100 | #260 | Tragic 13.1% |
| Trinidadians and Tobagonians | 0.1 /100 | #261 | Tragic 13.1% |
| Spanish American Indians | 0.1 /100 | #262 | Tragic 13.1% |
| Central Americans | 0.1 /100 | #263 | Tragic 13.2% |
| Iroquois | 0.1 /100 | #264 | Tragic 13.2% |
| Jamaicans | 0.1 /100 | #265 | Tragic 13.2% |
| Immigrants | Guyana | 0.1 /100 | #266 | Tragic 13.2% |