Immigrants from Trinidad and Tobago vs Immigrants from Bosnia and Herzegovina Poverty
COMPARE
Immigrants from Trinidad and Tobago
Immigrants from Bosnia and Herzegovina
Poverty
Poverty Comparison
Immigrants from Trinidad and Tobago
Immigrants from Bosnia and Herzegovina
14.2%
POVERTY
0.2/ 100
METRIC RATING
253rd/ 347
METRIC RANK
12.0%
POVERTY
73.7/ 100
METRIC RATING
147th/ 347
METRIC RANK
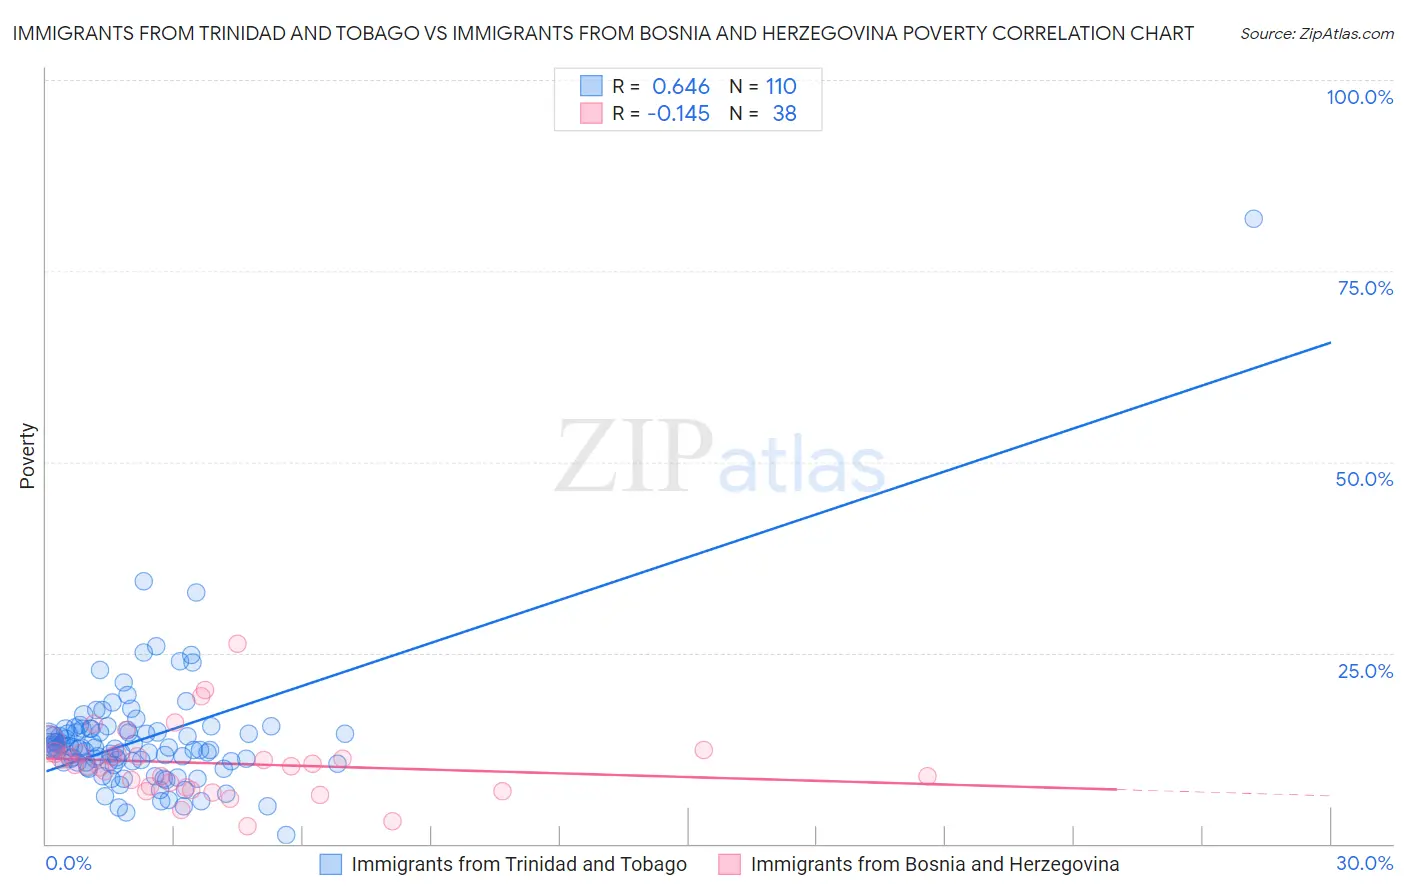
Immigrants from Trinidad and Tobago vs Immigrants from Bosnia and Herzegovina Poverty Correlation Chart
The statistical analysis conducted on geographies consisting of 223,476,613 people shows a significant positive correlation between the proportion of Immigrants from Trinidad and Tobago and poverty level in the United States with a correlation coefficient (R) of 0.646 and weighted average of 14.2%. Similarly, the statistical analysis conducted on geographies consisting of 156,765,120 people shows a poor negative correlation between the proportion of Immigrants from Bosnia and Herzegovina and poverty level in the United States with a correlation coefficient (R) of -0.145 and weighted average of 12.0%, a difference of 18.6%.
Poverty Correlation Summary
| Measurement | Immigrants from Trinidad and Tobago | Immigrants from Bosnia and Herzegovina |
| Minimum | 1.1% | 2.3% |
| Maximum | 81.9% | 26.2% |
| Range | 80.8% | 23.9% |
| Mean | 13.7% | 10.5% |
| Median | 12.5% | 10.2% |
| Interquartile 25% (IQ1) | 10.6% | 7.4% |
| Interquartile 75% (IQ3) | 14.9% | 11.8% |
| Interquartile Range (IQR) | 4.3% | 4.4% |
| Standard Deviation (Sample) | 8.4% | 4.7% |
| Standard Deviation (Population) | 8.4% | 4.6% |
Similar Demographics by Poverty
Demographics Similar to Immigrants from Trinidad and Tobago by Poverty
In terms of poverty, the demographic groups most similar to Immigrants from Trinidad and Tobago are Spanish American Indian (14.2%, a difference of 0.10%), Immigrants from Burma/Myanmar (14.2%, a difference of 0.22%), Immigrants from El Salvador (14.3%, a difference of 0.25%), Cree (14.2%, a difference of 0.31%), and Immigrants from Ecuador (14.3%, a difference of 0.35%).
| Demographics | Rating | Rank | Poverty |
| Potawatomi | 0.3 /100 | #246 | Tragic 14.1% |
| Liberians | 0.2 /100 | #247 | Tragic 14.1% |
| Immigrants | Western Africa | 0.2 /100 | #248 | Tragic 14.1% |
| Immigrants | Ghana | 0.2 /100 | #249 | Tragic 14.2% |
| Cree | 0.2 /100 | #250 | Tragic 14.2% |
| Immigrants | Burma/Myanmar | 0.2 /100 | #251 | Tragic 14.2% |
| Spanish American Indians | 0.2 /100 | #252 | Tragic 14.2% |
| Immigrants | Trinidad and Tobago | 0.2 /100 | #253 | Tragic 14.2% |
| Immigrants | El Salvador | 0.1 /100 | #254 | Tragic 14.3% |
| Immigrants | Ecuador | 0.1 /100 | #255 | Tragic 14.3% |
| Mexican American Indians | 0.1 /100 | #256 | Tragic 14.3% |
| Trinidadians and Tobagonians | 0.1 /100 | #257 | Tragic 14.3% |
| Ottawa | 0.1 /100 | #258 | Tragic 14.3% |
| Immigrants | Nicaragua | 0.1 /100 | #259 | Tragic 14.3% |
| Cape Verdeans | 0.1 /100 | #260 | Tragic 14.4% |
Demographics Similar to Immigrants from Bosnia and Herzegovina by Poverty
In terms of poverty, the demographic groups most similar to Immigrants from Bosnia and Herzegovina are Immigrants from Germany (12.0%, a difference of 0.12%), Immigrants from Malaysia (12.0%, a difference of 0.12%), Afghan (12.0%, a difference of 0.16%), Immigrants from Kazakhstan (12.0%, a difference of 0.17%), and Syrian (12.0%, a difference of 0.19%).
| Demographics | Rating | Rank | Poverty |
| Immigrants | Peru | 81.1 /100 | #140 | Excellent 11.9% |
| Immigrants | France | 80.5 /100 | #141 | Excellent 11.9% |
| Basques | 80.4 /100 | #142 | Excellent 11.9% |
| Brazilians | 79.7 /100 | #143 | Good 11.9% |
| Icelanders | 77.9 /100 | #144 | Good 11.9% |
| Syrians | 75.1 /100 | #145 | Good 12.0% |
| Afghans | 74.9 /100 | #146 | Good 12.0% |
| Immigrants | Bosnia and Herzegovina | 73.7 /100 | #147 | Good 12.0% |
| Immigrants | Germany | 72.7 /100 | #148 | Good 12.0% |
| Immigrants | Malaysia | 72.7 /100 | #149 | Good 12.0% |
| Immigrants | Kazakhstan | 72.3 /100 | #150 | Good 12.0% |
| Samoans | 71.9 /100 | #151 | Good 12.0% |
| Armenians | 67.6 /100 | #152 | Good 12.1% |
| Immigrants | Northern Africa | 63.9 /100 | #153 | Good 12.1% |
| Guamanians/Chamorros | 63.9 /100 | #154 | Good 12.1% |