Immigrants from Taiwan vs White/Caucasian Female Poverty
COMPARE
Immigrants from Taiwan
White/Caucasian
Female Poverty
Female Poverty Comparison
Immigrants from Taiwan
Whites/Caucasians
10.5%
FEMALE POVERTY
100.0/ 100
METRIC RATING
4th/ 347
METRIC RANK
13.4%
FEMALE POVERTY
54.6/ 100
METRIC RATING
171st/ 347
METRIC RANK
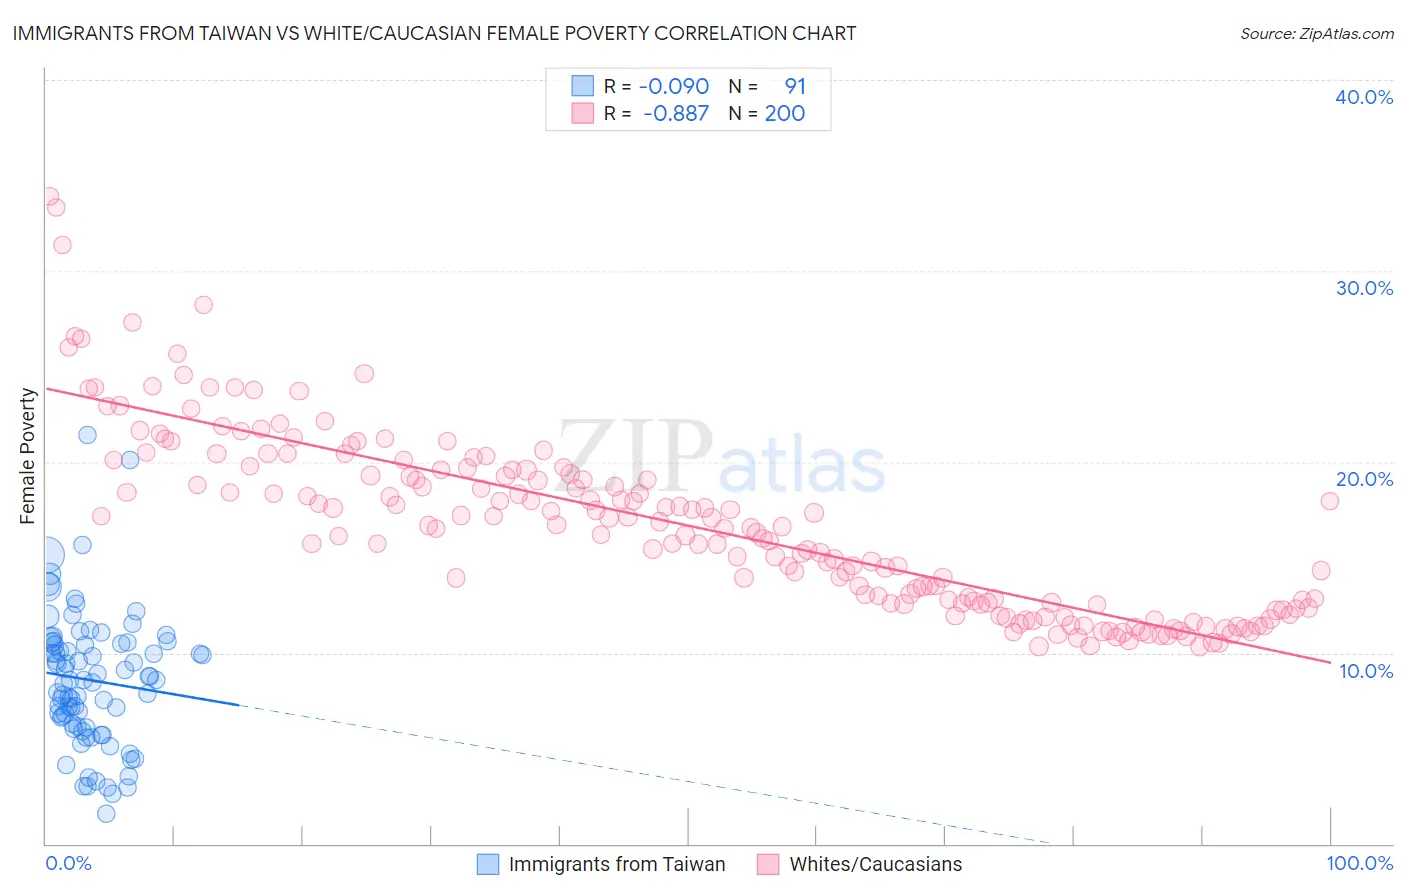
Immigrants from Taiwan vs White/Caucasian Female Poverty Correlation Chart
The statistical analysis conducted on geographies consisting of 298,090,597 people shows a slight negative correlation between the proportion of Immigrants from Taiwan and poverty level among females in the United States with a correlation coefficient (R) of -0.090 and weighted average of 10.5%. Similarly, the statistical analysis conducted on geographies consisting of 583,112,868 people shows a very strong negative correlation between the proportion of Whites/Caucasians and poverty level among females in the United States with a correlation coefficient (R) of -0.887 and weighted average of 13.4%, a difference of 27.0%.
Female Poverty Correlation Summary
| Measurement | Immigrants from Taiwan | White/Caucasian |
| Minimum | 1.5% | 10.3% |
| Maximum | 21.4% | 33.9% |
| Range | 19.9% | 23.6% |
| Mean | 8.6% | 16.7% |
| Median | 8.6% | 16.5% |
| Interquartile 25% (IQ1) | 6.2% | 12.6% |
| Interquartile 75% (IQ3) | 10.5% | 19.6% |
| Interquartile Range (IQR) | 4.4% | 7.0% |
| Standard Deviation (Sample) | 3.5% | 4.7% |
| Standard Deviation (Population) | 3.5% | 4.7% |
Similar Demographics by Female Poverty
Demographics Similar to Immigrants from Taiwan by Female Poverty
In terms of female poverty, the demographic groups most similar to Immigrants from Taiwan are Thai (10.5%, a difference of 0.76%), Chinese (10.4%, a difference of 1.4%), Filipino (10.9%, a difference of 3.9%), Immigrants from Ireland (11.0%, a difference of 4.3%), and Assyrian/Chaldean/Syriac (11.0%, a difference of 4.7%).
| Demographics | Rating | Rank | Female Poverty |
| Immigrants | India | 100.0 /100 | #1 | Exceptional 9.9% |
| Chinese | 100.0 /100 | #2 | Exceptional 10.4% |
| Thais | 100.0 /100 | #3 | Exceptional 10.5% |
| Immigrants | Taiwan | 100.0 /100 | #4 | Exceptional 10.5% |
| Filipinos | 100.0 /100 | #5 | Exceptional 10.9% |
| Immigrants | Ireland | 99.9 /100 | #6 | Exceptional 11.0% |
| Assyrians/Chaldeans/Syriacs | 99.9 /100 | #7 | Exceptional 11.0% |
| Immigrants | South Central Asia | 99.9 /100 | #8 | Exceptional 11.1% |
| Bulgarians | 99.9 /100 | #9 | Exceptional 11.1% |
| Immigrants | Hong Kong | 99.9 /100 | #10 | Exceptional 11.2% |
| Maltese | 99.9 /100 | #11 | Exceptional 11.2% |
| Bhutanese | 99.9 /100 | #12 | Exceptional 11.3% |
| Immigrants | Lithuania | 99.9 /100 | #13 | Exceptional 11.3% |
| Lithuanians | 99.8 /100 | #14 | Exceptional 11.4% |
| Latvians | 99.8 /100 | #15 | Exceptional 11.4% |
Demographics Similar to Whites/Caucasians by Female Poverty
In terms of female poverty, the demographic groups most similar to Whites/Caucasians are Mongolian (13.4%, a difference of 0.10%), Colombian (13.4%, a difference of 0.11%), Lebanese (13.4%, a difference of 0.13%), Aleut (13.4%, a difference of 0.21%), and Immigrants from Chile (13.3%, a difference of 0.27%).
| Demographics | Rating | Rank | Female Poverty |
| Ethiopians | 62.3 /100 | #164 | Good 13.3% |
| Scotch-Irish | 62.1 /100 | #165 | Good 13.3% |
| Immigrants | Oceania | 59.7 /100 | #166 | Average 13.3% |
| Immigrants | Chile | 57.4 /100 | #167 | Average 13.3% |
| Aleuts | 56.7 /100 | #168 | Average 13.4% |
| Lebanese | 55.9 /100 | #169 | Average 13.4% |
| Colombians | 55.7 /100 | #170 | Average 13.4% |
| Whites/Caucasians | 54.6 /100 | #171 | Average 13.4% |
| Mongolians | 53.6 /100 | #172 | Average 13.4% |
| Immigrants | Afghanistan | 50.8 /100 | #173 | Average 13.4% |
| Immigrants | Iraq | 50.0 /100 | #174 | Average 13.4% |
| Celtics | 49.9 /100 | #175 | Average 13.4% |
| Immigrants | Spain | 49.9 /100 | #176 | Average 13.4% |
| Immigrants | Morocco | 49.4 /100 | #177 | Average 13.4% |
| Israelis | 49.1 /100 | #178 | Average 13.5% |