Immigrants from Syria vs Polish Female Poverty
COMPARE
Immigrants from Syria
Polish
Female Poverty
Female Poverty Comparison
Immigrants from Syria
Poles
13.5%
FEMALE POVERTY
48.8/ 100
METRIC RATING
179th/ 347
METRIC RANK
11.7%
FEMALE POVERTY
99.5/ 100
METRIC RATING
31st/ 347
METRIC RANK
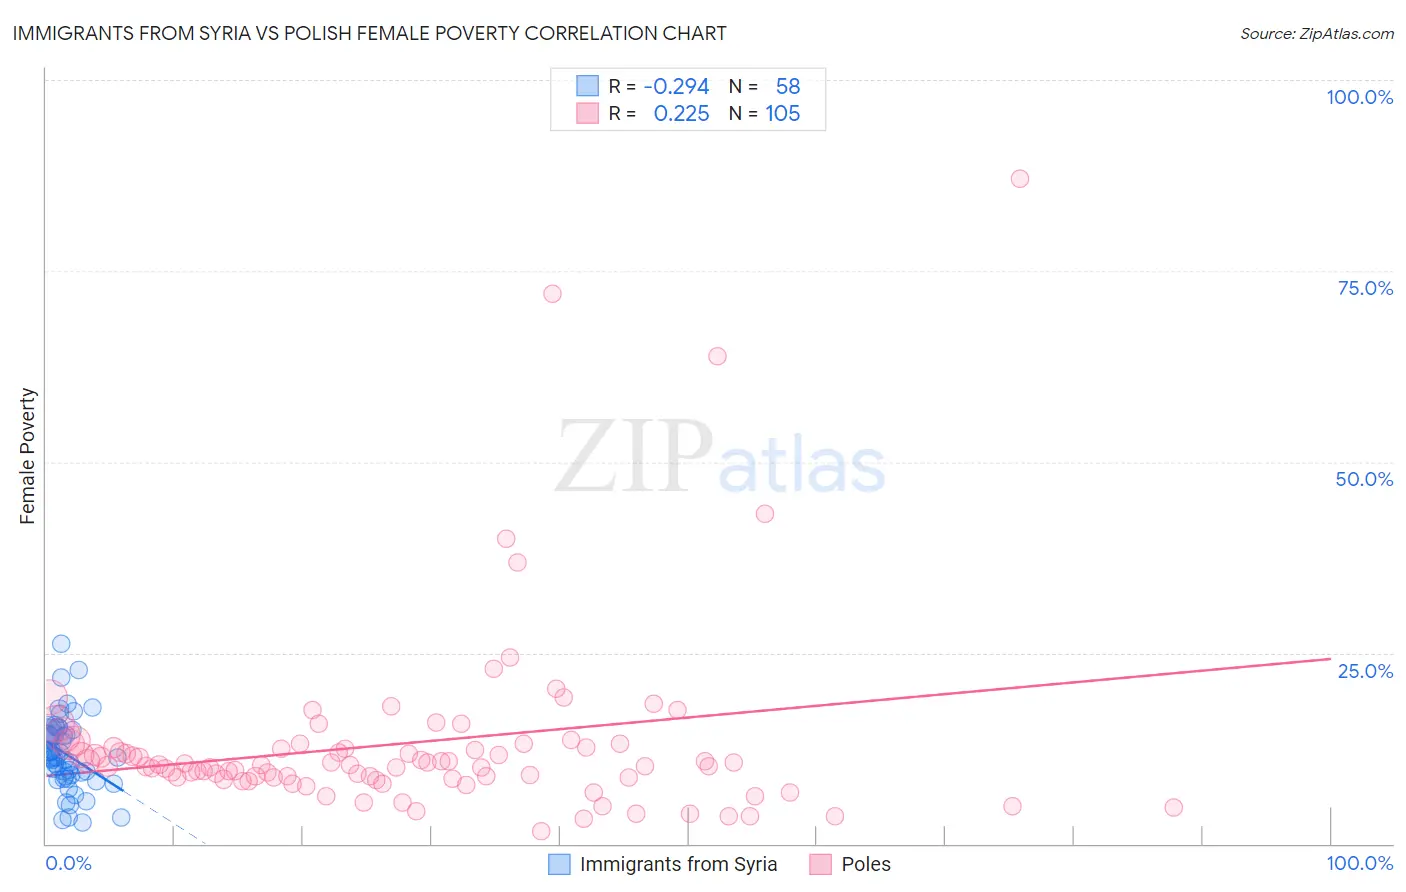
Immigrants from Syria vs Polish Female Poverty Correlation Chart
The statistical analysis conducted on geographies consisting of 174,099,384 people shows a weak negative correlation between the proportion of Immigrants from Syria and poverty level among females in the United States with a correlation coefficient (R) of -0.294 and weighted average of 13.5%. Similarly, the statistical analysis conducted on geographies consisting of 559,323,396 people shows a weak positive correlation between the proportion of Poles and poverty level among females in the United States with a correlation coefficient (R) of 0.225 and weighted average of 11.7%, a difference of 14.7%.
Female Poverty Correlation Summary
| Measurement | Immigrants from Syria | Polish |
| Minimum | 2.7% | 1.6% |
| Maximum | 26.2% | 87.1% |
| Range | 23.5% | 85.5% |
| Mean | 11.8% | 13.1% |
| Median | 11.3% | 10.3% |
| Interquartile 25% (IQ1) | 8.8% | 8.6% |
| Interquartile 75% (IQ3) | 14.5% | 12.8% |
| Interquartile Range (IQR) | 5.7% | 4.3% |
| Standard Deviation (Sample) | 4.8% | 12.4% |
| Standard Deviation (Population) | 4.7% | 12.4% |
Similar Demographics by Female Poverty
Demographics Similar to Immigrants from Syria by Female Poverty
In terms of female poverty, the demographic groups most similar to Immigrants from Syria are Israeli (13.5%, a difference of 0.030%), Immigrants from Morocco (13.4%, a difference of 0.060%), Immigrants from Spain (13.4%, a difference of 0.10%), Celtic (13.4%, a difference of 0.11%), and Immigrants from Iraq (13.4%, a difference of 0.12%).
| Demographics | Rating | Rank | Female Poverty |
| Mongolians | 53.6 /100 | #172 | Average 13.4% |
| Immigrants | Afghanistan | 50.8 /100 | #173 | Average 13.4% |
| Immigrants | Iraq | 50.0 /100 | #174 | Average 13.4% |
| Celtics | 49.9 /100 | #175 | Average 13.4% |
| Immigrants | Spain | 49.9 /100 | #176 | Average 13.4% |
| Immigrants | Morocco | 49.4 /100 | #177 | Average 13.4% |
| Israelis | 49.1 /100 | #178 | Average 13.5% |
| Immigrants | Syria | 48.8 /100 | #179 | Average 13.5% |
| South Americans | 44.8 /100 | #180 | Average 13.5% |
| Venezuelans | 44.5 /100 | #181 | Average 13.5% |
| Immigrants | Colombia | 44.5 /100 | #182 | Average 13.5% |
| Kenyans | 43.8 /100 | #183 | Average 13.5% |
| Immigrants | Sierra Leone | 43.2 /100 | #184 | Average 13.5% |
| Immigrants | Cameroon | 42.0 /100 | #185 | Average 13.5% |
| Immigrants | Portugal | 41.5 /100 | #186 | Average 13.6% |
Demographics Similar to Poles by Female Poverty
In terms of female poverty, the demographic groups most similar to Poles are Danish (11.7%, a difference of 0.13%), Cypriot (11.8%, a difference of 0.21%), Greek (11.7%, a difference of 0.22%), Immigrants from North Macedonia (11.7%, a difference of 0.30%), and Immigrants from Singapore (11.8%, a difference of 0.32%).
| Demographics | Rating | Rank | Female Poverty |
| Luxembourgers | 99.7 /100 | #24 | Exceptional 11.6% |
| Immigrants | Northern Europe | 99.6 /100 | #25 | Exceptional 11.6% |
| Croatians | 99.6 /100 | #26 | Exceptional 11.6% |
| Iranians | 99.6 /100 | #27 | Exceptional 11.7% |
| Immigrants | Korea | 99.6 /100 | #28 | Exceptional 11.7% |
| Immigrants | North Macedonia | 99.6 /100 | #29 | Exceptional 11.7% |
| Greeks | 99.5 /100 | #30 | Exceptional 11.7% |
| Poles | 99.5 /100 | #31 | Exceptional 11.7% |
| Danes | 99.5 /100 | #32 | Exceptional 11.7% |
| Cypriots | 99.5 /100 | #33 | Exceptional 11.8% |
| Immigrants | Singapore | 99.4 /100 | #34 | Exceptional 11.8% |
| Immigrants | Iran | 99.4 /100 | #35 | Exceptional 11.8% |
| Immigrants | Pakistan | 99.4 /100 | #36 | Exceptional 11.8% |
| Immigrants | Greece | 99.3 /100 | #37 | Exceptional 11.8% |
| Russians | 99.3 /100 | #38 | Exceptional 11.8% |