Immigrants from St. Vincent and the Grenadines vs Native/Alaskan Single Male Poverty
COMPARE
Immigrants from St. Vincent and the Grenadines
Native/Alaskan
Single Male Poverty
Single Male Poverty Comparison
Immigrants from St. Vincent and the Grenadines
Natives/Alaskans
12.8%
SINGLE MALE POVERTY
50.9/ 100
METRIC RATING
173rd/ 347
METRIC RANK
19.6%
SINGLE MALE POVERTY
0.0/ 100
METRIC RATING
332nd/ 347
METRIC RANK
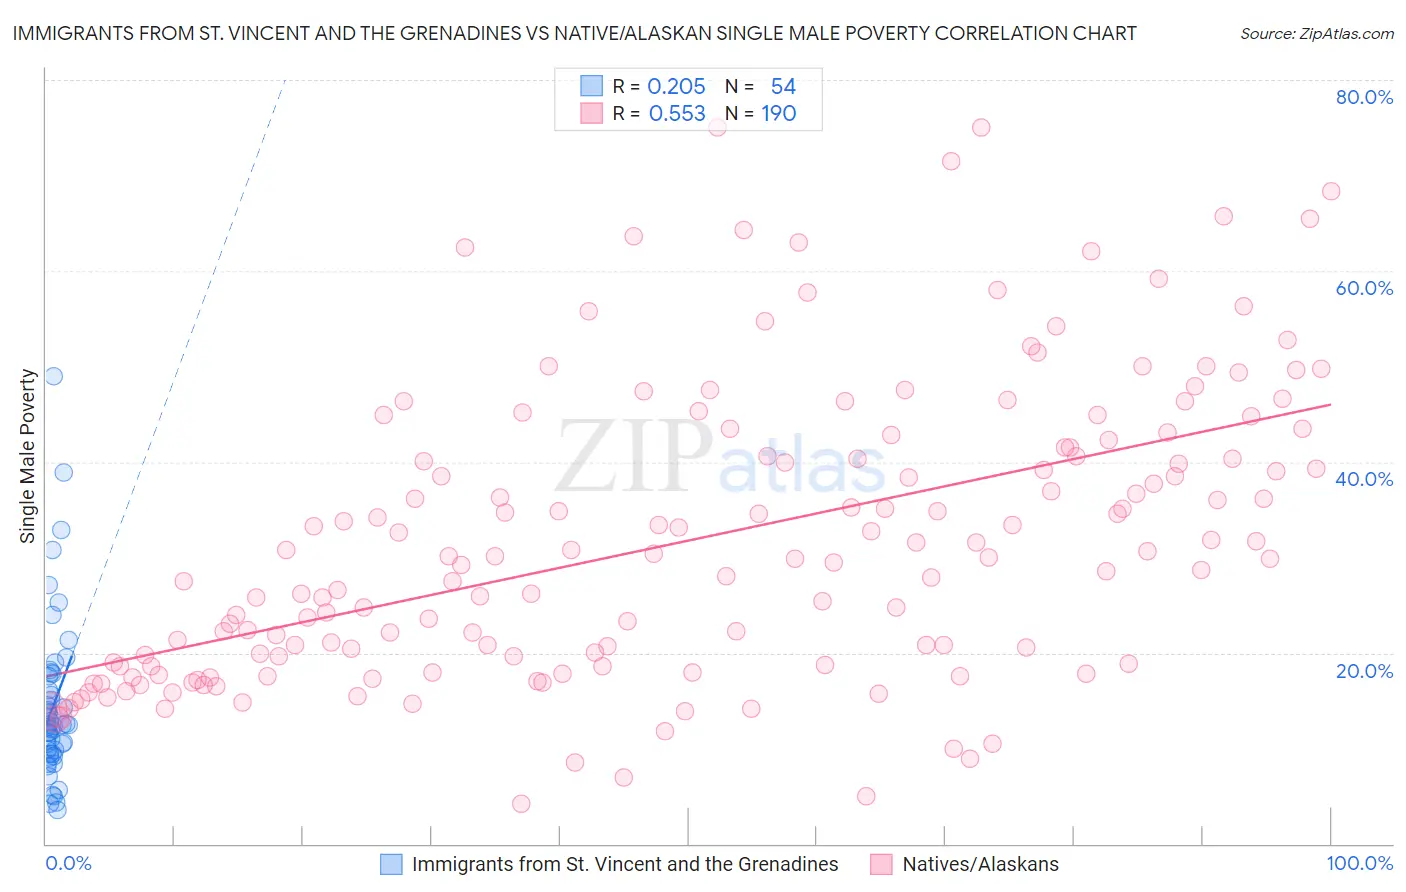
Immigrants from St. Vincent and the Grenadines vs Native/Alaskan Single Male Poverty Correlation Chart
The statistical analysis conducted on geographies consisting of 54,238,308 people shows a weak positive correlation between the proportion of Immigrants from St. Vincent and the Grenadines and poverty level among single males in the United States with a correlation coefficient (R) of 0.205 and weighted average of 12.8%. Similarly, the statistical analysis conducted on geographies consisting of 444,255,067 people shows a substantial positive correlation between the proportion of Natives/Alaskans and poverty level among single males in the United States with a correlation coefficient (R) of 0.553 and weighted average of 19.6%, a difference of 53.3%.
Single Male Poverty Correlation Summary
| Measurement | Immigrants from St. Vincent and the Grenadines | Native/Alaskan |
| Minimum | 3.5% | 4.3% |
| Maximum | 49.0% | 75.0% |
| Range | 45.5% | 70.7% |
| Mean | 14.5% | 31.7% |
| Median | 12.4% | 29.9% |
| Interquartile 25% (IQ1) | 9.4% | 18.7% |
| Interquartile 75% (IQ3) | 17.5% | 41.5% |
| Interquartile Range (IQR) | 8.1% | 22.8% |
| Standard Deviation (Sample) | 8.6% | 15.2% |
| Standard Deviation (Population) | 8.5% | 15.2% |
Similar Demographics by Single Male Poverty
Demographics Similar to Immigrants from St. Vincent and the Grenadines by Single Male Poverty
In terms of single male poverty, the demographic groups most similar to Immigrants from St. Vincent and the Grenadines are South African (12.8%, a difference of 0.030%), Danish (12.8%, a difference of 0.030%), Costa Rican (12.8%, a difference of 0.050%), Guyanese (12.8%, a difference of 0.060%), and Croatian (12.8%, a difference of 0.11%).
| Demographics | Rating | Rank | Single Male Poverty |
| Immigrants | Guyana | 60.5 /100 | #166 | Good 12.7% |
| Immigrants | Sudan | 58.2 /100 | #167 | Average 12.7% |
| Immigrants | Barbados | 57.7 /100 | #168 | Average 12.7% |
| Puget Sound Salish | 54.3 /100 | #169 | Average 12.8% |
| Guyanese | 52.0 /100 | #170 | Average 12.8% |
| South Africans | 51.5 /100 | #171 | Average 12.8% |
| Danes | 51.4 /100 | #172 | Average 12.8% |
| Immigrants | St. Vincent and the Grenadines | 50.9 /100 | #173 | Average 12.8% |
| Costa Ricans | 50.0 /100 | #174 | Average 12.8% |
| Croatians | 48.9 /100 | #175 | Average 12.8% |
| Syrians | 48.4 /100 | #176 | Average 12.8% |
| Immigrants | Canada | 44.8 /100 | #177 | Average 12.8% |
| Immigrants | Switzerland | 43.1 /100 | #178 | Average 12.8% |
| Israelis | 41.0 /100 | #179 | Average 12.9% |
| Immigrants | North America | 37.7 /100 | #180 | Fair 12.9% |
Demographics Similar to Natives/Alaskans by Single Male Poverty
In terms of single male poverty, the demographic groups most similar to Natives/Alaskans are Paiute (19.3%, a difference of 1.7%), Inupiat (20.0%, a difference of 1.9%), Pima (20.2%, a difference of 2.7%), Cajun (19.1%, a difference of 2.8%), and Colville (18.4%, a difference of 6.4%).
| Demographics | Rating | Rank | Single Male Poverty |
| Choctaw | 0.0 /100 | #325 | Tragic 17.0% |
| Central American Indians | 0.0 /100 | #326 | Tragic 17.2% |
| Menominee | 0.0 /100 | #327 | Tragic 17.7% |
| Kiowa | 0.0 /100 | #328 | Tragic 18.3% |
| Colville | 0.0 /100 | #329 | Tragic 18.4% |
| Cajuns | 0.0 /100 | #330 | Tragic 19.1% |
| Paiute | 0.0 /100 | #331 | Tragic 19.3% |
| Natives/Alaskans | 0.0 /100 | #332 | Tragic 19.6% |
| Inupiat | 0.0 /100 | #333 | Tragic 20.0% |
| Pima | 0.0 /100 | #334 | Tragic 20.2% |
| Yuman | 0.0 /100 | #335 | Tragic 21.3% |
| Tohono O'odham | 0.0 /100 | #336 | Tragic 21.6% |
| Apache | 0.0 /100 | #337 | Tragic 21.6% |
| Pueblo | 0.0 /100 | #338 | Tragic 21.6% |
| Arapaho | 0.0 /100 | #339 | Tragic 21.9% |