Immigrants from St. Vincent and the Grenadines vs Native/Alaskan Unemployment Among Seniors over 75 years
COMPARE
Immigrants from St. Vincent and the Grenadines
Native/Alaskan
Unemployment Among Seniors over 75 years
Unemployment Among Seniors over 75 years Comparison
Immigrants from St. Vincent and the Grenadines
Natives/Alaskans
9.8%
UNEMPLOYMENT AMONG SENIORS OVER 75 YEARS
0.0/ 100
METRIC RATING
296th/ 347
METRIC RANK
10.2%
UNEMPLOYMENT AMONG SENIORS OVER 75 YEARS
0.0/ 100
METRIC RATING
316th/ 347
METRIC RANK
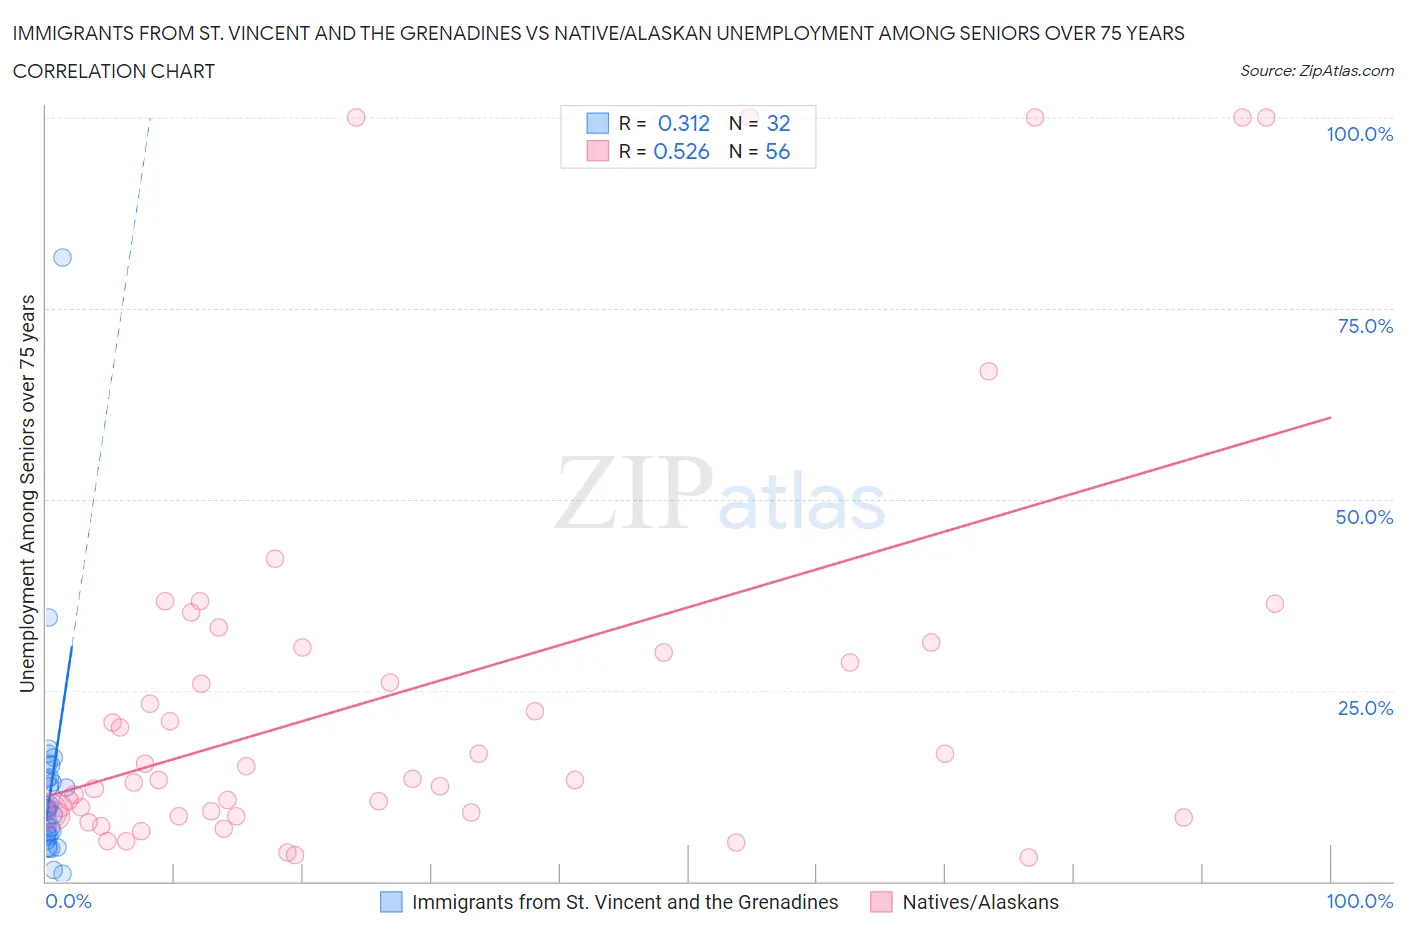
Immigrants from St. Vincent and the Grenadines vs Native/Alaskan Unemployment Among Seniors over 75 years Correlation Chart
The statistical analysis conducted on geographies consisting of 44,044,285 people shows a mild positive correlation between the proportion of Immigrants from St. Vincent and the Grenadines and unemployment rate among seniors over the age of 75 in the United States with a correlation coefficient (R) of 0.312 and weighted average of 9.8%. Similarly, the statistical analysis conducted on geographies consisting of 226,317,213 people shows a substantial positive correlation between the proportion of Natives/Alaskans and unemployment rate among seniors over the age of 75 in the United States with a correlation coefficient (R) of 0.526 and weighted average of 10.2%, a difference of 3.6%.
Unemployment Among Seniors over 75 years Correlation Summary
| Measurement | Immigrants from St. Vincent and the Grenadines | Native/Alaskan |
| Minimum | 1.0% | 3.1% |
| Maximum | 81.7% | 100.0% |
| Range | 80.7% | 96.9% |
| Mean | 12.2% | 24.8% |
| Median | 9.3% | 13.4% |
| Interquartile 25% (IQ1) | 6.0% | 8.8% |
| Interquartile 75% (IQ3) | 13.5% | 30.3% |
| Interquartile Range (IQR) | 7.5% | 21.5% |
| Standard Deviation (Sample) | 14.2% | 26.7% |
| Standard Deviation (Population) | 13.9% | 26.4% |
Demographics Similar to Immigrants from St. Vincent and the Grenadines and Natives/Alaskans by Unemployment Among Seniors over 75 years
In terms of unemployment among seniors over 75 years, the demographic groups most similar to Immigrants from St. Vincent and the Grenadines are Cherokee (9.8%, a difference of 0.080%), Lithuanian (9.9%, a difference of 0.46%), Belgian (9.9%, a difference of 0.74%), Iraqi (9.9%, a difference of 0.76%), and Welsh (10.0%, a difference of 1.2%). Similarly, the demographic groups most similar to Natives/Alaskans are Pennsylvania German (10.2%, a difference of 0.24%), Dutch West Indian (10.2%, a difference of 0.36%), Nepalese (10.1%, a difference of 0.80%), Chippewa (10.1%, a difference of 0.92%), and Scottish (10.1%, a difference of 0.94%).
| Demographics | Rating | Rank | Unemployment Among Seniors over 75 years |
| Immigrants | St. Vincent and the Grenadines | 0.0 /100 | #296 | Tragic 9.8% |
| Cherokee | 0.0 /100 | #297 | Tragic 9.8% |
| Lithuanians | 0.0 /100 | #298 | Tragic 9.9% |
| Belgians | 0.0 /100 | #299 | Tragic 9.9% |
| Iraqis | 0.0 /100 | #300 | Tragic 9.9% |
| Welsh | 0.0 /100 | #301 | Tragic 10.0% |
| Finns | 0.0 /100 | #302 | Tragic 10.0% |
| Puget Sound Salish | 0.0 /100 | #303 | Tragic 10.0% |
| Scotch-Irish | 0.0 /100 | #304 | Tragic 10.0% |
| Swedes | 0.0 /100 | #305 | Tragic 10.0% |
| Italians | 0.0 /100 | #306 | Tragic 10.0% |
| Immigrants | Fiji | 0.0 /100 | #307 | Tragic 10.0% |
| Whites/Caucasians | 0.0 /100 | #308 | Tragic 10.1% |
| English | 0.0 /100 | #309 | Tragic 10.1% |
| Hungarians | 0.0 /100 | #310 | Tragic 10.1% |
| Scottish | 0.0 /100 | #311 | Tragic 10.1% |
| Chippewa | 0.0 /100 | #312 | Tragic 10.1% |
| Nepalese | 0.0 /100 | #313 | Tragic 10.1% |
| Dutch West Indians | 0.0 /100 | #314 | Tragic 10.2% |
| Pennsylvania Germans | 0.0 /100 | #315 | Tragic 10.2% |
| Natives/Alaskans | 0.0 /100 | #316 | Tragic 10.2% |