Delaware vs Native/Alaskan Single Male Poverty
COMPARE
Delaware
Native/Alaskan
Single Male Poverty
Single Male Poverty Comparison
Delaware
Natives/Alaskans
15.0%
SINGLE MALE POVERTY
0.0/ 100
METRIC RATING
299th/ 347
METRIC RANK
19.6%
SINGLE MALE POVERTY
0.0/ 100
METRIC RATING
332nd/ 347
METRIC RANK
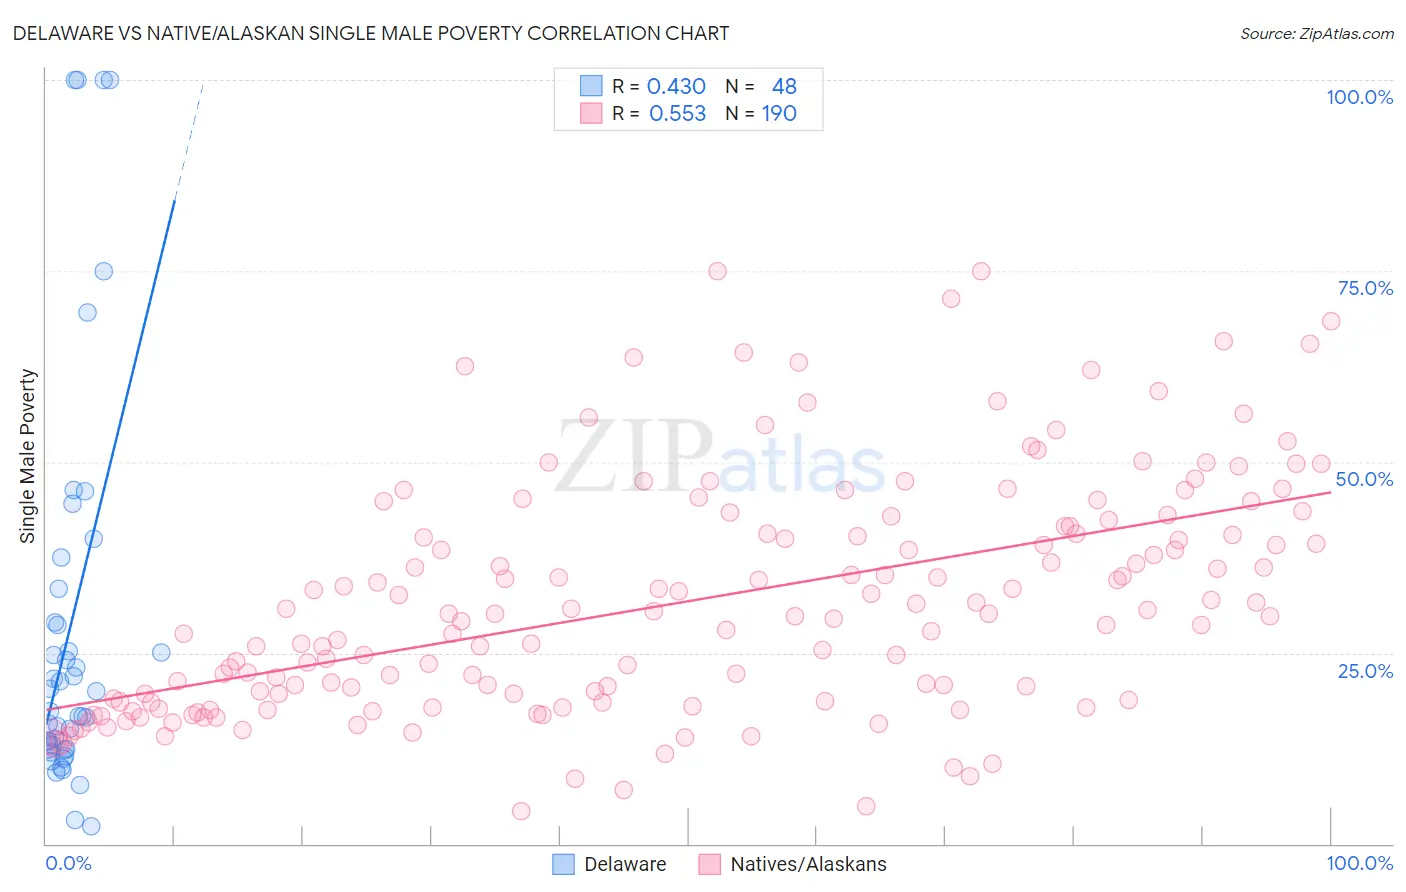
Delaware vs Native/Alaskan Single Male Poverty Correlation Chart
The statistical analysis conducted on geographies consisting of 90,922,782 people shows a moderate positive correlation between the proportion of Delaware and poverty level among single males in the United States with a correlation coefficient (R) of 0.430 and weighted average of 15.0%. Similarly, the statistical analysis conducted on geographies consisting of 444,255,067 people shows a substantial positive correlation between the proportion of Natives/Alaskans and poverty level among single males in the United States with a correlation coefficient (R) of 0.553 and weighted average of 19.6%, a difference of 30.5%.
Single Male Poverty Correlation Summary
| Measurement | Delaware | Native/Alaskan |
| Minimum | 2.4% | 4.3% |
| Maximum | 100.0% | 75.0% |
| Range | 97.6% | 70.7% |
| Mean | 28.5% | 31.7% |
| Median | 18.7% | 29.9% |
| Interquartile 25% (IQ1) | 12.6% | 18.7% |
| Interquartile 75% (IQ3) | 31.1% | 41.5% |
| Interquartile Range (IQR) | 18.5% | 22.8% |
| Standard Deviation (Sample) | 26.3% | 15.2% |
| Standard Deviation (Population) | 26.0% | 15.2% |
Similar Demographics by Single Male Poverty
Demographics Similar to Delaware by Single Male Poverty
In terms of single male poverty, the demographic groups most similar to Delaware are French American Indian (15.0%, a difference of 0.39%), Cree (15.1%, a difference of 0.45%), Dominican (15.2%, a difference of 1.3%), Alsatian (15.2%, a difference of 1.4%), and Immigrants from Dominican Republic (14.8%, a difference of 1.7%).
| Demographics | Rating | Rank | Single Male Poverty |
| Immigrants | Nonimmigrants | 0.0 /100 | #292 | Tragic 14.6% |
| French Canadians | 0.0 /100 | #293 | Tragic 14.6% |
| Ottawa | 0.0 /100 | #294 | Tragic 14.6% |
| Scotch-Irish | 0.0 /100 | #295 | Tragic 14.7% |
| Africans | 0.0 /100 | #296 | Tragic 14.7% |
| Immigrants | Dominican Republic | 0.0 /100 | #297 | Tragic 14.8% |
| French American Indians | 0.0 /100 | #298 | Tragic 15.0% |
| Delaware | 0.0 /100 | #299 | Tragic 15.0% |
| Cree | 0.0 /100 | #300 | Tragic 15.1% |
| Dominicans | 0.0 /100 | #301 | Tragic 15.2% |
| Alsatians | 0.0 /100 | #302 | Tragic 15.2% |
| Aleuts | 0.0 /100 | #303 | Tragic 15.4% |
| Alaska Natives | 0.0 /100 | #304 | Tragic 15.4% |
| Blackfeet | 0.0 /100 | #305 | Tragic 15.5% |
| Pennsylvania Germans | 0.0 /100 | #306 | Tragic 15.6% |
Demographics Similar to Natives/Alaskans by Single Male Poverty
In terms of single male poverty, the demographic groups most similar to Natives/Alaskans are Paiute (19.3%, a difference of 1.7%), Inupiat (20.0%, a difference of 1.9%), Pima (20.2%, a difference of 2.7%), Cajun (19.1%, a difference of 2.8%), and Colville (18.4%, a difference of 6.4%).
| Demographics | Rating | Rank | Single Male Poverty |
| Choctaw | 0.0 /100 | #325 | Tragic 17.0% |
| Central American Indians | 0.0 /100 | #326 | Tragic 17.2% |
| Menominee | 0.0 /100 | #327 | Tragic 17.7% |
| Kiowa | 0.0 /100 | #328 | Tragic 18.3% |
| Colville | 0.0 /100 | #329 | Tragic 18.4% |
| Cajuns | 0.0 /100 | #330 | Tragic 19.1% |
| Paiute | 0.0 /100 | #331 | Tragic 19.3% |
| Natives/Alaskans | 0.0 /100 | #332 | Tragic 19.6% |
| Inupiat | 0.0 /100 | #333 | Tragic 20.0% |
| Pima | 0.0 /100 | #334 | Tragic 20.2% |
| Yuman | 0.0 /100 | #335 | Tragic 21.3% |
| Tohono O'odham | 0.0 /100 | #336 | Tragic 21.6% |
| Apache | 0.0 /100 | #337 | Tragic 21.6% |
| Pueblo | 0.0 /100 | #338 | Tragic 21.6% |
| Arapaho | 0.0 /100 | #339 | Tragic 21.9% |