Immigrants from South Eastern Asia vs Native/Alaskan Single Male Poverty
COMPARE
Immigrants from South Eastern Asia
Native/Alaskan
Single Male Poverty
Single Male Poverty Comparison
Immigrants from South Eastern Asia
Natives/Alaskans
11.4%
SINGLE MALE POVERTY
100.0/ 100
METRIC RATING
35th/ 347
METRIC RANK
19.6%
SINGLE MALE POVERTY
0.0/ 100
METRIC RATING
332nd/ 347
METRIC RANK
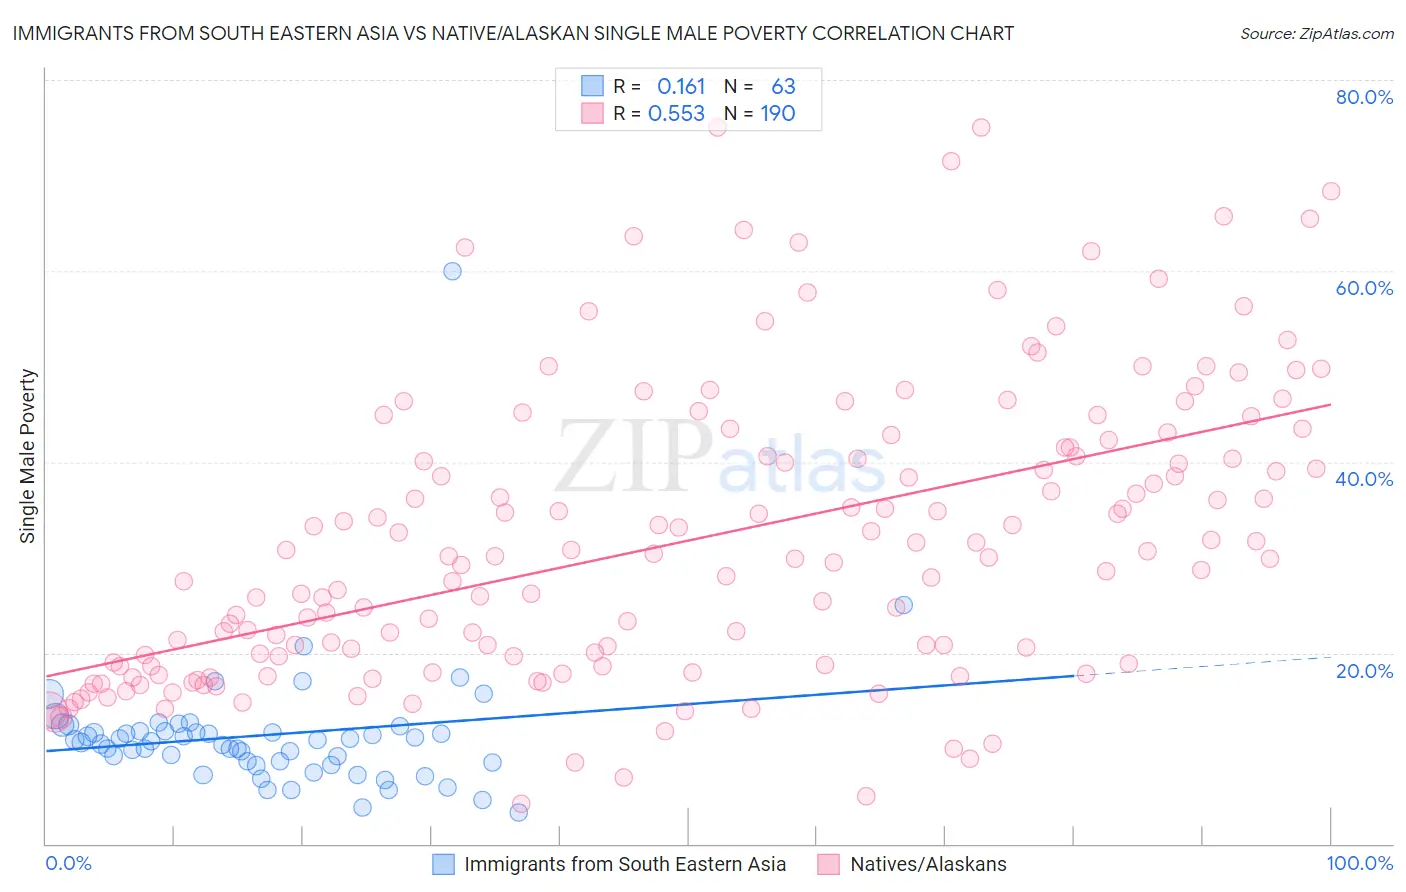
Immigrants from South Eastern Asia vs Native/Alaskan Single Male Poverty Correlation Chart
The statistical analysis conducted on geographies consisting of 439,025,043 people shows a poor positive correlation between the proportion of Immigrants from South Eastern Asia and poverty level among single males in the United States with a correlation coefficient (R) of 0.161 and weighted average of 11.4%. Similarly, the statistical analysis conducted on geographies consisting of 444,255,067 people shows a substantial positive correlation between the proportion of Natives/Alaskans and poverty level among single males in the United States with a correlation coefficient (R) of 0.553 and weighted average of 19.6%, a difference of 71.5%.
Single Male Poverty Correlation Summary
| Measurement | Immigrants from South Eastern Asia | Native/Alaskan |
| Minimum | 3.3% | 4.3% |
| Maximum | 60.0% | 75.0% |
| Range | 56.7% | 70.7% |
| Mean | 11.4% | 31.7% |
| Median | 10.7% | 29.9% |
| Interquartile 25% (IQ1) | 8.6% | 18.7% |
| Interquartile 75% (IQ3) | 11.7% | 41.5% |
| Interquartile Range (IQR) | 3.2% | 22.8% |
| Standard Deviation (Sample) | 7.3% | 15.2% |
| Standard Deviation (Population) | 7.2% | 15.2% |
Similar Demographics by Single Male Poverty
Demographics Similar to Immigrants from South Eastern Asia by Single Male Poverty
In terms of single male poverty, the demographic groups most similar to Immigrants from South Eastern Asia are Immigrants from Serbia (11.4%, a difference of 0.030%), Immigrants from Ethiopia (11.4%, a difference of 0.040%), Immigrants from Vietnam (11.4%, a difference of 0.080%), Immigrants from Singapore (11.4%, a difference of 0.080%), and Immigrants from Eastern Asia (11.4%, a difference of 0.15%).
| Demographics | Rating | Rank | Single Male Poverty |
| Immigrants | Asia | 100.0 /100 | #28 | Exceptional 11.4% |
| Immigrants | Egypt | 100.0 /100 | #29 | Exceptional 11.4% |
| Iranians | 100.0 /100 | #30 | Exceptional 11.4% |
| Immigrants | Iran | 100.0 /100 | #31 | Exceptional 11.4% |
| Immigrants | Eastern Asia | 100.0 /100 | #32 | Exceptional 11.4% |
| Immigrants | Vietnam | 100.0 /100 | #33 | Exceptional 11.4% |
| Immigrants | Ethiopia | 100.0 /100 | #34 | Exceptional 11.4% |
| Immigrants | South Eastern Asia | 100.0 /100 | #35 | Exceptional 11.4% |
| Immigrants | Serbia | 100.0 /100 | #36 | Exceptional 11.4% |
| Immigrants | Singapore | 100.0 /100 | #37 | Exceptional 11.4% |
| Sri Lankans | 100.0 /100 | #38 | Exceptional 11.5% |
| Soviet Union | 100.0 /100 | #39 | Exceptional 11.5% |
| Immigrants | Korea | 100.0 /100 | #40 | Exceptional 11.5% |
| Immigrants | Iraq | 99.9 /100 | #41 | Exceptional 11.5% |
| Egyptians | 99.9 /100 | #42 | Exceptional 11.5% |
Demographics Similar to Natives/Alaskans by Single Male Poverty
In terms of single male poverty, the demographic groups most similar to Natives/Alaskans are Paiute (19.3%, a difference of 1.7%), Inupiat (20.0%, a difference of 1.9%), Pima (20.2%, a difference of 2.7%), Cajun (19.1%, a difference of 2.8%), and Colville (18.4%, a difference of 6.4%).
| Demographics | Rating | Rank | Single Male Poverty |
| Choctaw | 0.0 /100 | #325 | Tragic 17.0% |
| Central American Indians | 0.0 /100 | #326 | Tragic 17.2% |
| Menominee | 0.0 /100 | #327 | Tragic 17.7% |
| Kiowa | 0.0 /100 | #328 | Tragic 18.3% |
| Colville | 0.0 /100 | #329 | Tragic 18.4% |
| Cajuns | 0.0 /100 | #330 | Tragic 19.1% |
| Paiute | 0.0 /100 | #331 | Tragic 19.3% |
| Natives/Alaskans | 0.0 /100 | #332 | Tragic 19.6% |
| Inupiat | 0.0 /100 | #333 | Tragic 20.0% |
| Pima | 0.0 /100 | #334 | Tragic 20.2% |
| Yuman | 0.0 /100 | #335 | Tragic 21.3% |
| Tohono O'odham | 0.0 /100 | #336 | Tragic 21.6% |
| Apache | 0.0 /100 | #337 | Tragic 21.6% |
| Pueblo | 0.0 /100 | #338 | Tragic 21.6% |
| Arapaho | 0.0 /100 | #339 | Tragic 21.9% |