Immigrants from St. Vincent and the Grenadines vs Vietnamese Single Male Poverty
COMPARE
Immigrants from St. Vincent and the Grenadines
Vietnamese
Single Male Poverty
Single Male Poverty Comparison
Immigrants from St. Vincent and the Grenadines
Vietnamese
12.8%
SINGLE MALE POVERTY
50.9/ 100
METRIC RATING
173rd/ 347
METRIC RANK
12.7%
SINGLE MALE POVERTY
67.9/ 100
METRIC RATING
156th/ 347
METRIC RANK
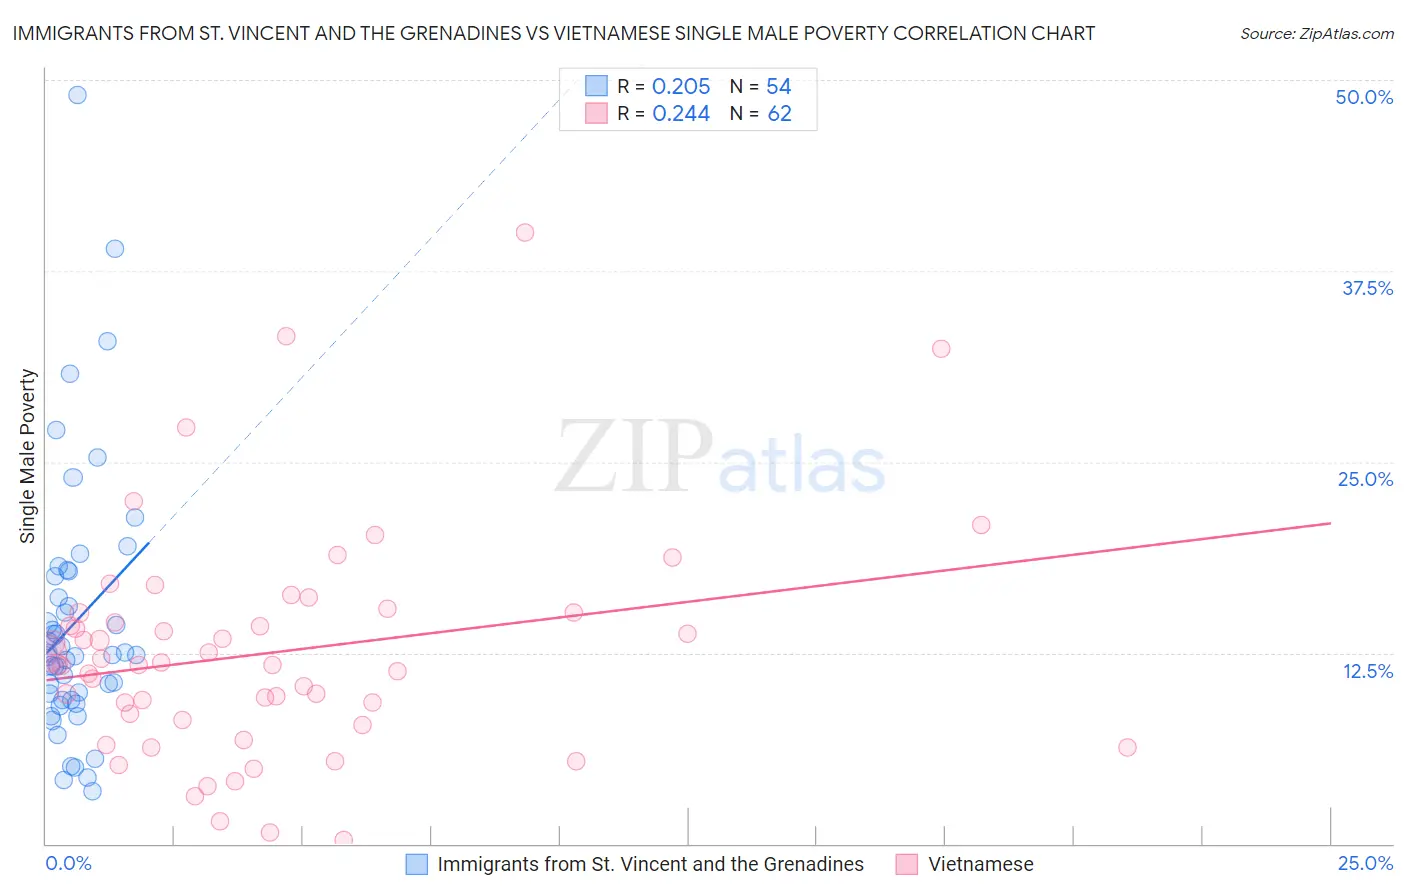
Immigrants from St. Vincent and the Grenadines vs Vietnamese Single Male Poverty Correlation Chart
The statistical analysis conducted on geographies consisting of 54,238,308 people shows a weak positive correlation between the proportion of Immigrants from St. Vincent and the Grenadines and poverty level among single males in the United States with a correlation coefficient (R) of 0.205 and weighted average of 12.8%. Similarly, the statistical analysis conducted on geographies consisting of 159,434,170 people shows a weak positive correlation between the proportion of Vietnamese and poverty level among single males in the United States with a correlation coefficient (R) of 0.244 and weighted average of 12.7%, a difference of 0.95%.
Single Male Poverty Correlation Summary
| Measurement | Immigrants from St. Vincent and the Grenadines | Vietnamese |
| Minimum | 3.5% | 0.23% |
| Maximum | 49.0% | 40.0% |
| Range | 45.5% | 39.8% |
| Mean | 14.5% | 12.5% |
| Median | 12.4% | 11.7% |
| Interquartile 25% (IQ1) | 9.4% | 8.1% |
| Interquartile 75% (IQ3) | 17.5% | 15.1% |
| Interquartile Range (IQR) | 8.1% | 7.0% |
| Standard Deviation (Sample) | 8.6% | 7.4% |
| Standard Deviation (Population) | 8.5% | 7.4% |
Demographics Similar to Immigrants from St. Vincent and the Grenadines and Vietnamese by Single Male Poverty
In terms of single male poverty, the demographic groups most similar to Immigrants from St. Vincent and the Grenadines are South African (12.8%, a difference of 0.030%), Danish (12.8%, a difference of 0.030%), Costa Rican (12.8%, a difference of 0.050%), Guyanese (12.8%, a difference of 0.060%), and Puget Sound Salish (12.8%, a difference of 0.18%). Similarly, the demographic groups most similar to Vietnamese are Latvian (12.7%, a difference of 0.0%), Immigrants from Spain (12.7%, a difference of 0.040%), Immigrants from Scotland (12.7%, a difference of 0.060%), Immigrants from Middle Africa (12.7%, a difference of 0.18%), and Immigrants from Liberia (12.7%, a difference of 0.22%).
| Demographics | Rating | Rank | Single Male Poverty |
| Immigrants | Scotland | 68.9 /100 | #154 | Good 12.7% |
| Immigrants | Spain | 68.7 /100 | #155 | Good 12.7% |
| Vietnamese | 67.9 /100 | #156 | Good 12.7% |
| Latvians | 67.9 /100 | #157 | Good 12.7% |
| Immigrants | Middle Africa | 64.9 /100 | #158 | Good 12.7% |
| Immigrants | Liberia | 64.2 /100 | #159 | Good 12.7% |
| Greeks | 64.1 /100 | #160 | Good 12.7% |
| Immigrants | Africa | 63.4 /100 | #161 | Good 12.7% |
| Eastern Europeans | 63.3 /100 | #162 | Good 12.7% |
| Palestinians | 63.1 /100 | #163 | Good 12.7% |
| Immigrants | Nigeria | 62.8 /100 | #164 | Good 12.7% |
| Immigrants | Cambodia | 62.2 /100 | #165 | Good 12.7% |
| Immigrants | Guyana | 60.5 /100 | #166 | Good 12.7% |
| Immigrants | Sudan | 58.2 /100 | #167 | Average 12.7% |
| Immigrants | Barbados | 57.7 /100 | #168 | Average 12.7% |
| Puget Sound Salish | 54.3 /100 | #169 | Average 12.8% |
| Guyanese | 52.0 /100 | #170 | Average 12.8% |
| South Africans | 51.5 /100 | #171 | Average 12.8% |
| Danes | 51.4 /100 | #172 | Average 12.8% |
| Immigrants | St. Vincent and the Grenadines | 50.9 /100 | #173 | Average 12.8% |
| Costa Ricans | 50.0 /100 | #174 | Average 12.8% |