Immigrants from St. Vincent and the Grenadines vs Yakama Child Poverty Under the Age of 5
COMPARE
Immigrants from St. Vincent and the Grenadines
Yakama
Child Poverty Under the Age of 5
Child Poverty Under the Age of 5 Comparison
Immigrants from St. Vincent and the Grenadines
Yakama
20.0%
CHILD POVERTY UNDER THE AGE OF 5
0.2/ 100
METRIC RATING
258th/ 347
METRIC RANK
23.1%
CHILD POVERTY UNDER THE AGE OF 5
0.0/ 100
METRIC RATING
316th/ 347
METRIC RANK
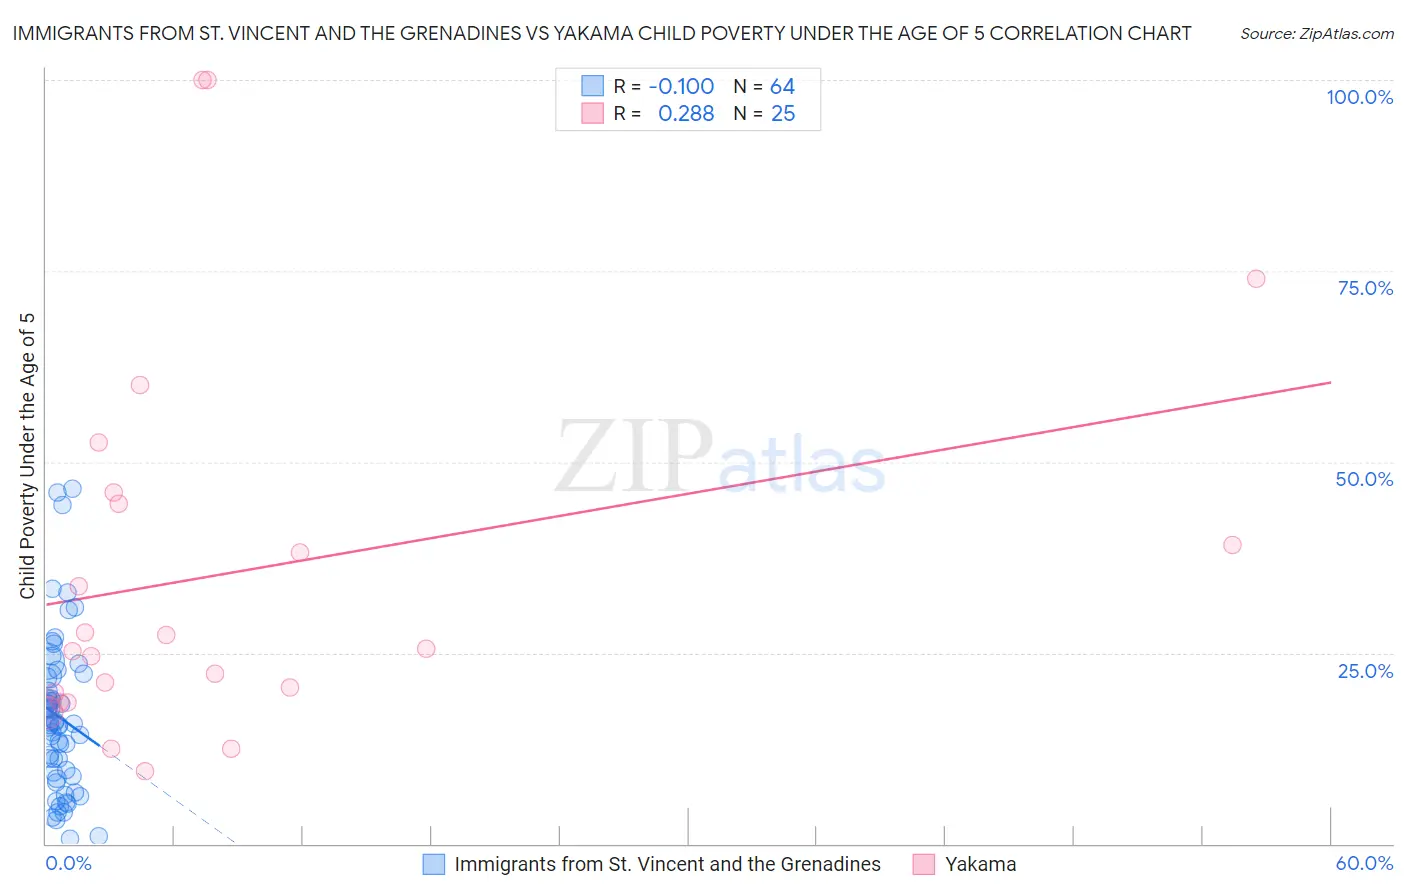
Immigrants from St. Vincent and the Grenadines vs Yakama Child Poverty Under the Age of 5 Correlation Chart
The statistical analysis conducted on geographies consisting of 55,885,863 people shows a slight negative correlation between the proportion of Immigrants from St. Vincent and the Grenadines and poverty level among children under the age of 5 in the United States with a correlation coefficient (R) of -0.100 and weighted average of 20.0%. Similarly, the statistical analysis conducted on geographies consisting of 19,733,416 people shows a weak positive correlation between the proportion of Yakama and poverty level among children under the age of 5 in the United States with a correlation coefficient (R) of 0.288 and weighted average of 23.1%, a difference of 15.8%.
Child Poverty Under the Age of 5 Correlation Summary
| Measurement | Immigrants from St. Vincent and the Grenadines | Yakama |
| Minimum | 0.65% | 9.4% |
| Maximum | 46.4% | 100.0% |
| Range | 45.8% | 90.6% |
| Mean | 16.6% | 35.6% |
| Median | 15.7% | 25.6% |
| Interquartile 25% (IQ1) | 9.1% | 19.1% |
| Interquartile 75% (IQ3) | 21.9% | 45.3% |
| Interquartile Range (IQR) | 12.8% | 26.1% |
| Standard Deviation (Sample) | 10.2% | 24.9% |
| Standard Deviation (Population) | 10.1% | 24.4% |
Similar Demographics by Child Poverty Under the Age of 5
Demographics Similar to Immigrants from St. Vincent and the Grenadines by Child Poverty Under the Age of 5
In terms of child poverty under the age of 5, the demographic groups most similar to Immigrants from St. Vincent and the Grenadines are Immigrants from El Salvador (20.0%, a difference of 0.030%), Shoshone (20.0%, a difference of 0.14%), Immigrants from Barbados (20.0%, a difference of 0.15%), Immigrants from Cuba (19.9%, a difference of 0.37%), and Spanish American (20.1%, a difference of 0.43%).
| Demographics | Rating | Rank | Child Poverty Under the Age of 5 |
| Pennsylvania Germans | 0.3 /100 | #251 | Tragic 19.8% |
| Immigrants | Nicaragua | 0.3 /100 | #252 | Tragic 19.8% |
| Mexican American Indians | 0.3 /100 | #253 | Tragic 19.9% |
| Fijians | 0.3 /100 | #254 | Tragic 19.9% |
| Immigrants | Cuba | 0.2 /100 | #255 | Tragic 19.9% |
| Immigrants | Barbados | 0.2 /100 | #256 | Tragic 20.0% |
| Shoshone | 0.2 /100 | #257 | Tragic 20.0% |
| Immigrants | St. Vincent and the Grenadines | 0.2 /100 | #258 | Tragic 20.0% |
| Immigrants | El Salvador | 0.2 /100 | #259 | Tragic 20.0% |
| Spanish Americans | 0.2 /100 | #260 | Tragic 20.1% |
| Immigrants | Bangladesh | 0.2 /100 | #261 | Tragic 20.1% |
| Liberians | 0.1 /100 | #262 | Tragic 20.2% |
| Barbadians | 0.1 /100 | #263 | Tragic 20.2% |
| Immigrants | Liberia | 0.1 /100 | #264 | Tragic 20.2% |
| Spanish American Indians | 0.1 /100 | #265 | Tragic 20.2% |
Demographics Similar to Yakama by Child Poverty Under the Age of 5
In terms of child poverty under the age of 5, the demographic groups most similar to Yakama are Arapaho (23.1%, a difference of 0.12%), Menominee (23.3%, a difference of 0.50%), Dutch West Indian (23.3%, a difference of 0.60%), U.S. Virgin Islander (23.0%, a difference of 0.68%), and Bahamian (23.0%, a difference of 0.76%).
| Demographics | Rating | Rank | Child Poverty Under the Age of 5 |
| Houma | 0.0 /100 | #309 | Tragic 22.7% |
| Africans | 0.0 /100 | #310 | Tragic 22.8% |
| Seminole | 0.0 /100 | #311 | Tragic 22.8% |
| Hondurans | 0.0 /100 | #312 | Tragic 23.0% |
| Bahamians | 0.0 /100 | #313 | Tragic 23.0% |
| U.S. Virgin Islanders | 0.0 /100 | #314 | Tragic 23.0% |
| Arapaho | 0.0 /100 | #315 | Tragic 23.1% |
| Yakama | 0.0 /100 | #316 | Tragic 23.1% |
| Menominee | 0.0 /100 | #317 | Tragic 23.3% |
| Dutch West Indians | 0.0 /100 | #318 | Tragic 23.3% |
| Chippewa | 0.0 /100 | #319 | Tragic 23.4% |
| Choctaw | 0.0 /100 | #320 | Tragic 23.5% |
| Immigrants | Honduras | 0.0 /100 | #321 | Tragic 23.5% |
| Ute | 0.0 /100 | #322 | Tragic 23.5% |
| Pueblo | 0.0 /100 | #323 | Tragic 23.7% |