Immigrants from St. Vincent and the Grenadines vs Syrian Child Poverty Under the Age of 5
COMPARE
Immigrants from St. Vincent and the Grenadines
Syrian
Child Poverty Under the Age of 5
Child Poverty Under the Age of 5 Comparison
Immigrants from St. Vincent and the Grenadines
Syrians
20.0%
CHILD POVERTY UNDER THE AGE OF 5
0.2/ 100
METRIC RATING
258th/ 347
METRIC RANK
16.6%
CHILD POVERTY UNDER THE AGE OF 5
79.1/ 100
METRIC RATING
148th/ 347
METRIC RANK
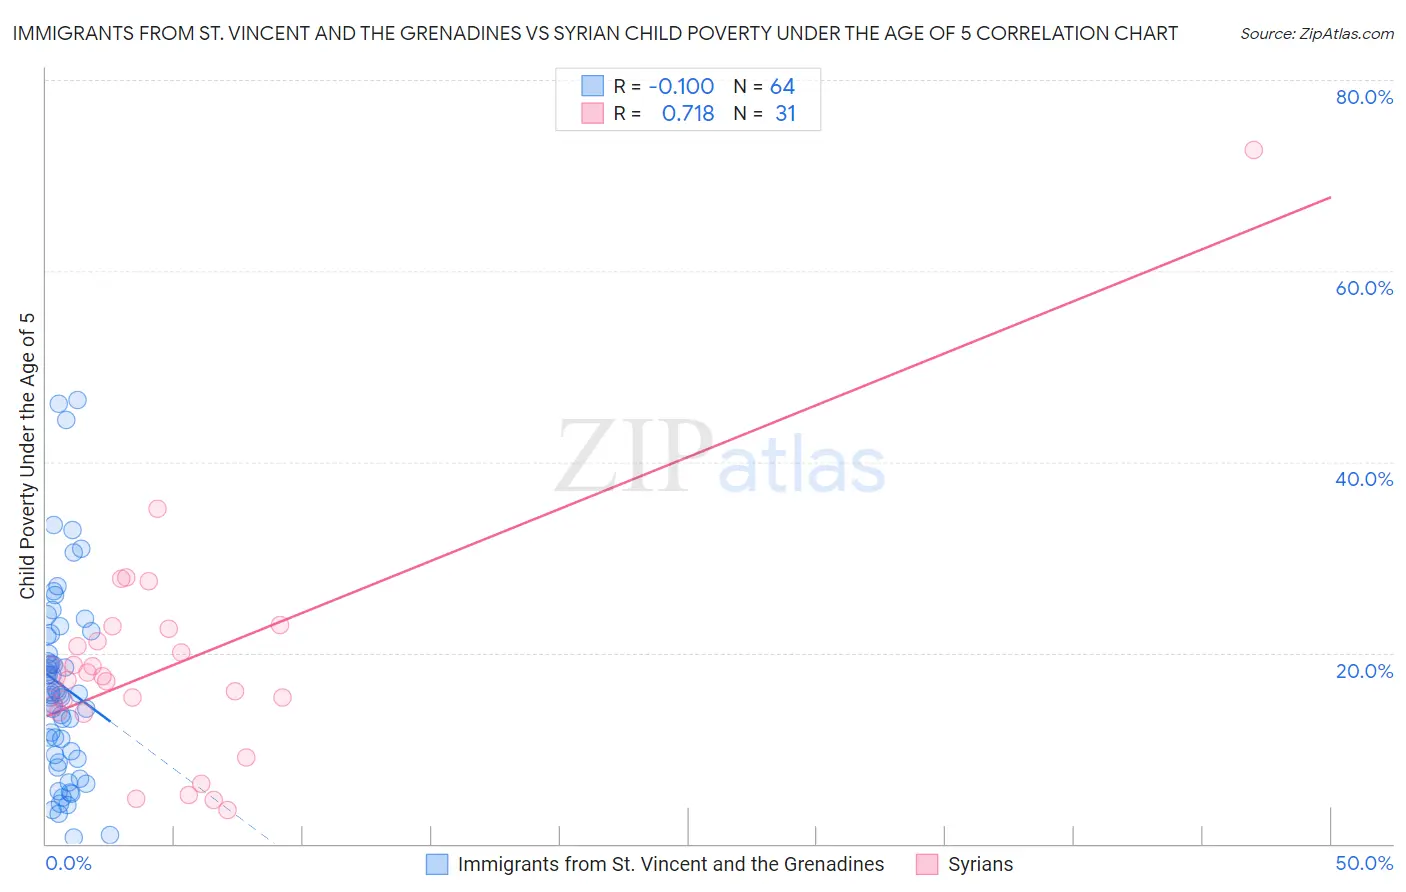
Immigrants from St. Vincent and the Grenadines vs Syrian Child Poverty Under the Age of 5 Correlation Chart
The statistical analysis conducted on geographies consisting of 55,885,863 people shows a slight negative correlation between the proportion of Immigrants from St. Vincent and the Grenadines and poverty level among children under the age of 5 in the United States with a correlation coefficient (R) of -0.100 and weighted average of 20.0%. Similarly, the statistical analysis conducted on geographies consisting of 256,842,692 people shows a strong positive correlation between the proportion of Syrians and poverty level among children under the age of 5 in the United States with a correlation coefficient (R) of 0.718 and weighted average of 16.6%, a difference of 20.2%.
Child Poverty Under the Age of 5 Correlation Summary
| Measurement | Immigrants from St. Vincent and the Grenadines | Syrian |
| Minimum | 0.65% | 3.5% |
| Maximum | 46.4% | 72.7% |
| Range | 45.8% | 69.2% |
| Mean | 16.6% | 18.8% |
| Median | 15.7% | 17.5% |
| Interquartile 25% (IQ1) | 9.1% | 13.8% |
| Interquartile 75% (IQ3) | 21.9% | 22.5% |
| Interquartile Range (IQR) | 12.8% | 8.7% |
| Standard Deviation (Sample) | 10.2% | 12.5% |
| Standard Deviation (Population) | 10.1% | 12.3% |
Similar Demographics by Child Poverty Under the Age of 5
Demographics Similar to Immigrants from St. Vincent and the Grenadines by Child Poverty Under the Age of 5
In terms of child poverty under the age of 5, the demographic groups most similar to Immigrants from St. Vincent and the Grenadines are Immigrants from El Salvador (20.0%, a difference of 0.030%), Shoshone (20.0%, a difference of 0.14%), Immigrants from Barbados (20.0%, a difference of 0.15%), Immigrants from Cuba (19.9%, a difference of 0.37%), and Spanish American (20.1%, a difference of 0.43%).
| Demographics | Rating | Rank | Child Poverty Under the Age of 5 |
| Pennsylvania Germans | 0.3 /100 | #251 | Tragic 19.8% |
| Immigrants | Nicaragua | 0.3 /100 | #252 | Tragic 19.8% |
| Mexican American Indians | 0.3 /100 | #253 | Tragic 19.9% |
| Fijians | 0.3 /100 | #254 | Tragic 19.9% |
| Immigrants | Cuba | 0.2 /100 | #255 | Tragic 19.9% |
| Immigrants | Barbados | 0.2 /100 | #256 | Tragic 20.0% |
| Shoshone | 0.2 /100 | #257 | Tragic 20.0% |
| Immigrants | St. Vincent and the Grenadines | 0.2 /100 | #258 | Tragic 20.0% |
| Immigrants | El Salvador | 0.2 /100 | #259 | Tragic 20.0% |
| Spanish Americans | 0.2 /100 | #260 | Tragic 20.1% |
| Immigrants | Bangladesh | 0.2 /100 | #261 | Tragic 20.1% |
| Liberians | 0.1 /100 | #262 | Tragic 20.2% |
| Barbadians | 0.1 /100 | #263 | Tragic 20.2% |
| Immigrants | Liberia | 0.1 /100 | #264 | Tragic 20.2% |
| Spanish American Indians | 0.1 /100 | #265 | Tragic 20.2% |
Demographics Similar to Syrians by Child Poverty Under the Age of 5
In terms of child poverty under the age of 5, the demographic groups most similar to Syrians are New Zealander (16.6%, a difference of 0.060%), Immigrants from Nepal (16.6%, a difference of 0.19%), Colombian (16.7%, a difference of 0.20%), Canadian (16.7%, a difference of 0.23%), and Belgian (16.7%, a difference of 0.30%).
| Demographics | Rating | Rank | Child Poverty Under the Age of 5 |
| Immigrants | Western Europe | 83.3 /100 | #141 | Excellent 16.5% |
| Portuguese | 83.0 /100 | #142 | Excellent 16.5% |
| Samoans | 83.0 /100 | #143 | Excellent 16.5% |
| Ethiopians | 82.7 /100 | #144 | Excellent 16.5% |
| Immigrants | Ethiopia | 82.1 /100 | #145 | Excellent 16.6% |
| Israelis | 82.0 /100 | #146 | Excellent 16.6% |
| Immigrants | Nepal | 80.3 /100 | #147 | Excellent 16.6% |
| Syrians | 79.1 /100 | #148 | Good 16.6% |
| New Zealanders | 78.7 /100 | #149 | Good 16.6% |
| Colombians | 77.8 /100 | #150 | Good 16.7% |
| Canadians | 77.6 /100 | #151 | Good 16.7% |
| Belgians | 77.2 /100 | #152 | Good 16.7% |
| Dutch | 77.1 /100 | #153 | Good 16.7% |
| Immigrants | Venezuela | 76.0 /100 | #154 | Good 16.7% |
| South Americans | 75.1 /100 | #155 | Good 16.7% |