Immigrants from St. Vincent and the Grenadines vs Tlingit-Haida Child Poverty Under the Age of 5
COMPARE
Immigrants from St. Vincent and the Grenadines
Tlingit-Haida
Child Poverty Under the Age of 5
Child Poverty Under the Age of 5 Comparison
Immigrants from St. Vincent and the Grenadines
Tlingit-Haida
20.0%
CHILD POVERTY UNDER THE AGE OF 5
0.2/ 100
METRIC RATING
258th/ 347
METRIC RANK
15.9%
CHILD POVERTY UNDER THE AGE OF 5
94.7/ 100
METRIC RATING
106th/ 347
METRIC RANK
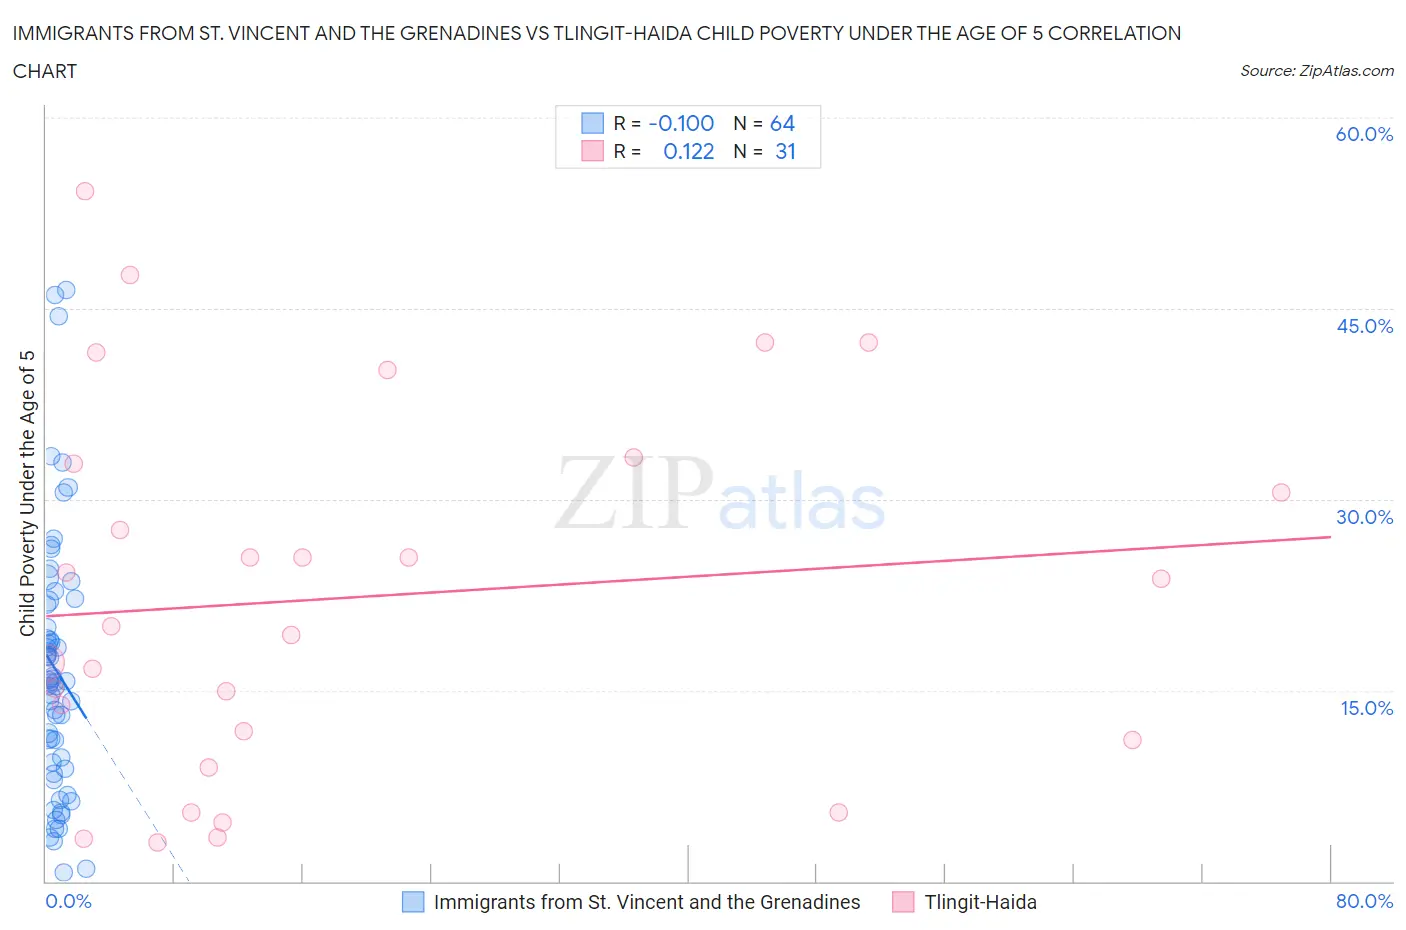
Immigrants from St. Vincent and the Grenadines vs Tlingit-Haida Child Poverty Under the Age of 5 Correlation Chart
The statistical analysis conducted on geographies consisting of 55,885,863 people shows a slight negative correlation between the proportion of Immigrants from St. Vincent and the Grenadines and poverty level among children under the age of 5 in the United States with a correlation coefficient (R) of -0.100 and weighted average of 20.0%. Similarly, the statistical analysis conducted on geographies consisting of 59,941,006 people shows a poor positive correlation between the proportion of Tlingit-Haida and poverty level among children under the age of 5 in the United States with a correlation coefficient (R) of 0.122 and weighted average of 15.9%, a difference of 25.4%.
Child Poverty Under the Age of 5 Correlation Summary
| Measurement | Immigrants from St. Vincent and the Grenadines | Tlingit-Haida |
| Minimum | 0.65% | 3.0% |
| Maximum | 46.4% | 54.2% |
| Range | 45.8% | 51.2% |
| Mean | 16.6% | 22.3% |
| Median | 15.7% | 20.0% |
| Interquartile 25% (IQ1) | 9.1% | 11.1% |
| Interquartile 75% (IQ3) | 21.9% | 32.8% |
| Interquartile Range (IQR) | 12.8% | 21.7% |
| Standard Deviation (Sample) | 10.2% | 14.3% |
| Standard Deviation (Population) | 10.1% | 14.1% |
Similar Demographics by Child Poverty Under the Age of 5
Demographics Similar to Immigrants from St. Vincent and the Grenadines by Child Poverty Under the Age of 5
In terms of child poverty under the age of 5, the demographic groups most similar to Immigrants from St. Vincent and the Grenadines are Immigrants from El Salvador (20.0%, a difference of 0.030%), Shoshone (20.0%, a difference of 0.14%), Immigrants from Barbados (20.0%, a difference of 0.15%), Immigrants from Cuba (19.9%, a difference of 0.37%), and Spanish American (20.1%, a difference of 0.43%).
| Demographics | Rating | Rank | Child Poverty Under the Age of 5 |
| Pennsylvania Germans | 0.3 /100 | #251 | Tragic 19.8% |
| Immigrants | Nicaragua | 0.3 /100 | #252 | Tragic 19.8% |
| Mexican American Indians | 0.3 /100 | #253 | Tragic 19.9% |
| Fijians | 0.3 /100 | #254 | Tragic 19.9% |
| Immigrants | Cuba | 0.2 /100 | #255 | Tragic 19.9% |
| Immigrants | Barbados | 0.2 /100 | #256 | Tragic 20.0% |
| Shoshone | 0.2 /100 | #257 | Tragic 20.0% |
| Immigrants | St. Vincent and the Grenadines | 0.2 /100 | #258 | Tragic 20.0% |
| Immigrants | El Salvador | 0.2 /100 | #259 | Tragic 20.0% |
| Spanish Americans | 0.2 /100 | #260 | Tragic 20.1% |
| Immigrants | Bangladesh | 0.2 /100 | #261 | Tragic 20.1% |
| Liberians | 0.1 /100 | #262 | Tragic 20.2% |
| Barbadians | 0.1 /100 | #263 | Tragic 20.2% |
| Immigrants | Liberia | 0.1 /100 | #264 | Tragic 20.2% |
| Spanish American Indians | 0.1 /100 | #265 | Tragic 20.2% |
Demographics Similar to Tlingit-Haida by Child Poverty Under the Age of 5
In terms of child poverty under the age of 5, the demographic groups most similar to Tlingit-Haida are Immigrants from Spain (15.9%, a difference of 0.050%), Immigrants from North America (15.9%, a difference of 0.12%), Slovene (16.0%, a difference of 0.14%), Immigrants from Brazil (16.0%, a difference of 0.16%), and Northern European (16.0%, a difference of 0.24%).
| Demographics | Rating | Rank | Child Poverty Under the Age of 5 |
| Palestinians | 95.9 /100 | #99 | Exceptional 15.8% |
| Immigrants | Canada | 95.9 /100 | #100 | Exceptional 15.8% |
| Immigrants | Zimbabwe | 95.9 /100 | #101 | Exceptional 15.8% |
| Armenians | 95.7 /100 | #102 | Exceptional 15.8% |
| Europeans | 95.3 /100 | #103 | Exceptional 15.9% |
| Immigrants | North America | 94.9 /100 | #104 | Exceptional 15.9% |
| Immigrants | Spain | 94.8 /100 | #105 | Exceptional 15.9% |
| Tlingit-Haida | 94.7 /100 | #106 | Exceptional 15.9% |
| Slovenes | 94.4 /100 | #107 | Exceptional 16.0% |
| Immigrants | Brazil | 94.4 /100 | #108 | Exceptional 16.0% |
| Northern Europeans | 94.3 /100 | #109 | Exceptional 16.0% |
| Romanians | 94.3 /100 | #110 | Exceptional 16.0% |
| Pakistanis | 94.2 /100 | #111 | Exceptional 16.0% |
| Peruvians | 94.1 /100 | #112 | Exceptional 16.0% |
| Puget Sound Salish | 94.1 /100 | #113 | Exceptional 16.0% |