Immigrants from St. Vincent and the Grenadines vs Carpatho Rusyn Female Poverty
COMPARE
Immigrants from St. Vincent and the Grenadines
Carpatho Rusyn
Female Poverty
Female Poverty Comparison
Immigrants from St. Vincent and the Grenadines
Carpatho Rusyns
15.9%
FEMALE POVERTY
0.0/ 100
METRIC RATING
271st/ 347
METRIC RANK
12.2%
FEMALE POVERTY
97.6/ 100
METRIC RATING
71st/ 347
METRIC RANK
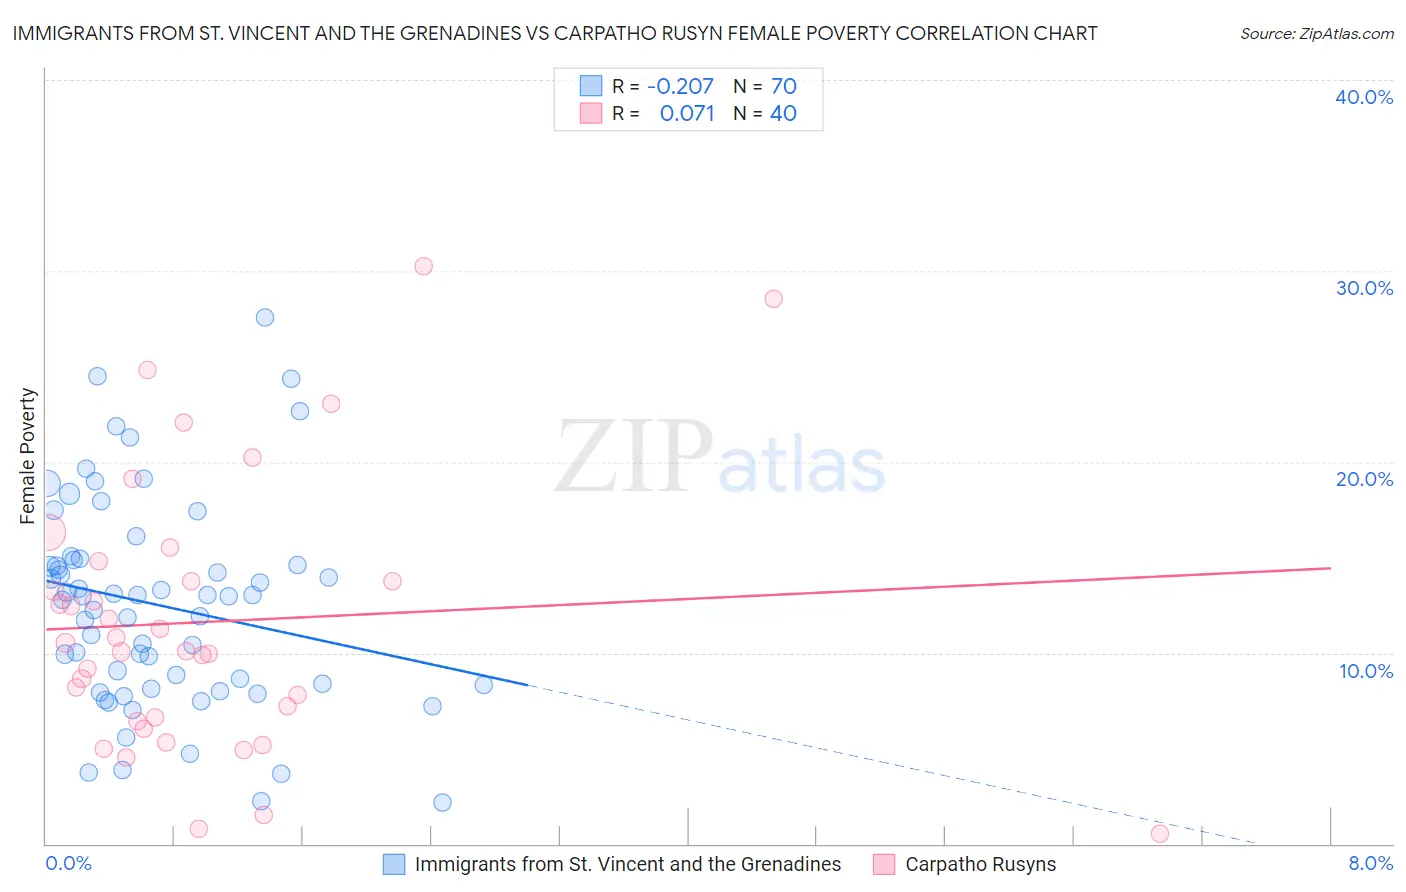
Immigrants from St. Vincent and the Grenadines vs Carpatho Rusyn Female Poverty Correlation Chart
The statistical analysis conducted on geographies consisting of 56,090,975 people shows a weak negative correlation between the proportion of Immigrants from St. Vincent and the Grenadines and poverty level among females in the United States with a correlation coefficient (R) of -0.207 and weighted average of 15.9%. Similarly, the statistical analysis conducted on geographies consisting of 58,861,278 people shows a slight positive correlation between the proportion of Carpatho Rusyns and poverty level among females in the United States with a correlation coefficient (R) of 0.071 and weighted average of 12.2%, a difference of 29.9%.
Female Poverty Correlation Summary
| Measurement | Immigrants from St. Vincent and the Grenadines | Carpatho Rusyn |
| Minimum | 2.1% | 0.50% |
| Maximum | 27.6% | 30.2% |
| Range | 25.5% | 29.7% |
| Mean | 12.5% | 11.6% |
| Median | 13.0% | 10.3% |
| Interquartile 25% (IQ1) | 8.3% | 6.5% |
| Interquartile 75% (IQ3) | 14.8% | 14.3% |
| Interquartile Range (IQR) | 6.5% | 7.8% |
| Standard Deviation (Sample) | 5.4% | 7.1% |
| Standard Deviation (Population) | 5.4% | 7.0% |
Similar Demographics by Female Poverty
Demographics Similar to Immigrants from St. Vincent and the Grenadines by Female Poverty
In terms of female poverty, the demographic groups most similar to Immigrants from St. Vincent and the Grenadines are Belizean (15.9%, a difference of 0.23%), Haitian (15.9%, a difference of 0.23%), Barbadian (15.9%, a difference of 0.24%), Chickasaw (15.9%, a difference of 0.28%), and Immigrants from Barbados (16.0%, a difference of 0.30%).
| Demographics | Rating | Rank | Female Poverty |
| Immigrants | Ecuador | 0.1 /100 | #264 | Tragic 15.6% |
| Immigrants | Liberia | 0.1 /100 | #265 | Tragic 15.7% |
| Immigrants | El Salvador | 0.1 /100 | #266 | Tragic 15.7% |
| Sub-Saharan Africans | 0.1 /100 | #267 | Tragic 15.8% |
| Immigrants | Nicaragua | 0.1 /100 | #268 | Tragic 15.8% |
| Iroquois | 0.1 /100 | #269 | Tragic 15.8% |
| Chickasaw | 0.1 /100 | #270 | Tragic 15.9% |
| Immigrants | St. Vincent and the Grenadines | 0.0 /100 | #271 | Tragic 15.9% |
| Belizeans | 0.0 /100 | #272 | Tragic 15.9% |
| Haitians | 0.0 /100 | #273 | Tragic 15.9% |
| Barbadians | 0.0 /100 | #274 | Tragic 15.9% |
| Immigrants | Barbados | 0.0 /100 | #275 | Tragic 16.0% |
| Central Americans | 0.0 /100 | #276 | Tragic 16.0% |
| Bangladeshis | 0.0 /100 | #277 | Tragic 16.0% |
| Immigrants | West Indies | 0.0 /100 | #278 | Tragic 16.1% |
Demographics Similar to Carpatho Rusyns by Female Poverty
In terms of female poverty, the demographic groups most similar to Carpatho Rusyns are Cambodian (12.2%, a difference of 0.030%), Zimbabwean (12.3%, a difference of 0.050%), Immigrants from Canada (12.3%, a difference of 0.060%), Immigrants from Belgium (12.2%, a difference of 0.13%), and Swiss (12.2%, a difference of 0.15%).
| Demographics | Rating | Rank | Female Poverty |
| Germans | 98.0 /100 | #64 | Exceptional 12.2% |
| Indians (Asian) | 97.9 /100 | #65 | Exceptional 12.2% |
| Austrians | 97.9 /100 | #66 | Exceptional 12.2% |
| Immigrants | Eastern Asia | 97.8 /100 | #67 | Exceptional 12.2% |
| Immigrants | Netherlands | 97.8 /100 | #68 | Exceptional 12.2% |
| Swiss | 97.7 /100 | #69 | Exceptional 12.2% |
| Immigrants | Belgium | 97.7 /100 | #70 | Exceptional 12.2% |
| Carpatho Rusyns | 97.6 /100 | #71 | Exceptional 12.2% |
| Cambodians | 97.5 /100 | #72 | Exceptional 12.2% |
| Zimbabweans | 97.5 /100 | #73 | Exceptional 12.3% |
| Immigrants | Canada | 97.5 /100 | #74 | Exceptional 12.3% |
| Europeans | 97.4 /100 | #75 | Exceptional 12.3% |
| Immigrants | Eastern Europe | 97.2 /100 | #76 | Exceptional 12.3% |
| Serbians | 97.2 /100 | #77 | Exceptional 12.3% |
| Egyptians | 97.2 /100 | #78 | Exceptional 12.3% |