Immigrants from St. Vincent and the Grenadines vs Carpatho Rusyn Unemployment Among Ages 25 to 29 years
COMPARE
Immigrants from St. Vincent and the Grenadines
Carpatho Rusyn
Unemployment Among Ages 25 to 29 years
Unemployment Among Ages 25 to 29 years Comparison
Immigrants from St. Vincent and the Grenadines
Carpatho Rusyns
8.4%
UNEMPLOYMENT AMONG AGES 25 TO 29 YEARS
0.0/ 100
METRIC RATING
313th/ 347
METRIC RANK
6.3%
UNEMPLOYMENT AMONG AGES 25 TO 29 YEARS
96.9/ 100
METRIC RATING
74th/ 347
METRIC RANK
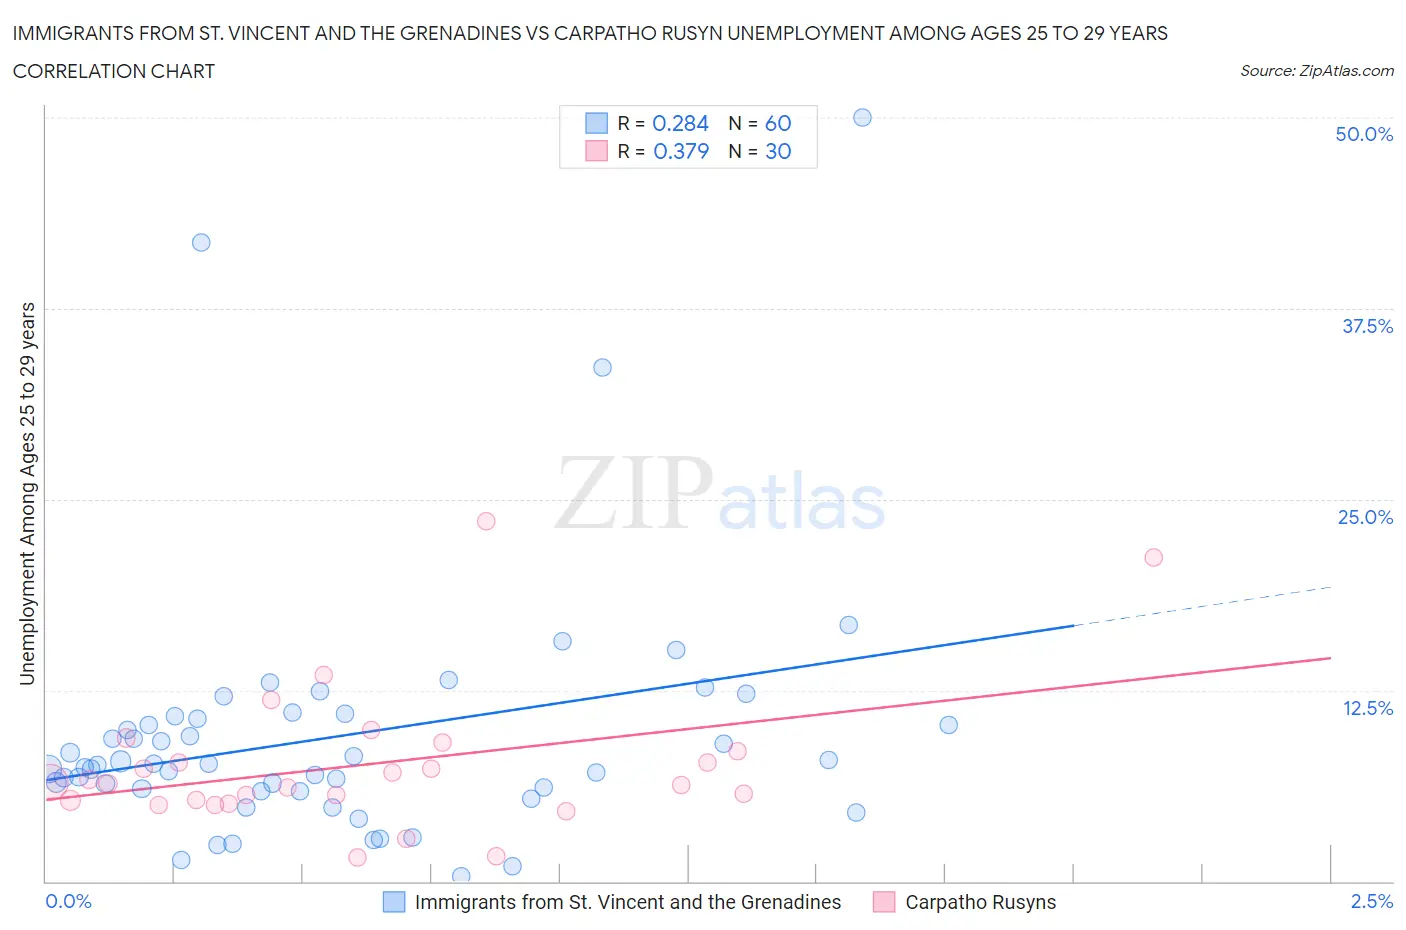
Immigrants from St. Vincent and the Grenadines vs Carpatho Rusyn Unemployment Among Ages 25 to 29 years Correlation Chart
The statistical analysis conducted on geographies consisting of 55,669,457 people shows a weak positive correlation between the proportion of Immigrants from St. Vincent and the Grenadines and unemployment rate among population between the ages 25 and 29 in the United States with a correlation coefficient (R) of 0.284 and weighted average of 8.4%. Similarly, the statistical analysis conducted on geographies consisting of 57,767,148 people shows a mild positive correlation between the proportion of Carpatho Rusyns and unemployment rate among population between the ages 25 and 29 in the United States with a correlation coefficient (R) of 0.379 and weighted average of 6.3%, a difference of 32.9%.
Unemployment Among Ages 25 to 29 years Correlation Summary
| Measurement | Immigrants from St. Vincent and the Grenadines | Carpatho Rusyn |
| Minimum | 0.30% | 1.6% |
| Maximum | 50.0% | 23.6% |
| Range | 49.7% | 22.0% |
| Mean | 9.5% | 7.7% |
| Median | 7.7% | 6.4% |
| Interquartile 25% (IQ1) | 6.0% | 5.3% |
| Interquartile 75% (IQ3) | 10.7% | 8.5% |
| Interquartile Range (IQR) | 4.7% | 3.2% |
| Standard Deviation (Sample) | 8.4% | 4.8% |
| Standard Deviation (Population) | 8.3% | 4.7% |
Similar Demographics by Unemployment Among Ages 25 to 29 years
Demographics Similar to Immigrants from St. Vincent and the Grenadines by Unemployment Among Ages 25 to 29 years
In terms of unemployment among ages 25 to 29 years, the demographic groups most similar to Immigrants from St. Vincent and the Grenadines are Immigrants from Dominica (8.4%, a difference of 0.35%), British West Indian (8.4%, a difference of 0.94%), Immigrants from Grenada (8.4%, a difference of 1.0%), Immigrants from Guyana (8.5%, a difference of 1.1%), and Guyanese (8.5%, a difference of 1.4%).
| Demographics | Rating | Rank | Unemployment Among Ages 25 to 29 years |
| Haitians | 0.0 /100 | #306 | Tragic 8.0% |
| Immigrants | Barbados | 0.0 /100 | #307 | Tragic 8.0% |
| Immigrants | Jamaica | 0.0 /100 | #308 | Tragic 8.1% |
| Immigrants | Haiti | 0.0 /100 | #309 | Tragic 8.1% |
| U.S. Virgin Islanders | 0.0 /100 | #310 | Tragic 8.1% |
| Immigrants | Azores | 0.0 /100 | #311 | Tragic 8.1% |
| Dutch West Indians | 0.0 /100 | #312 | Tragic 8.2% |
| Immigrants | St. Vincent and the Grenadines | 0.0 /100 | #313 | Tragic 8.4% |
| Immigrants | Dominica | 0.0 /100 | #314 | Tragic 8.4% |
| British West Indians | 0.0 /100 | #315 | Tragic 8.4% |
| Immigrants | Grenada | 0.0 /100 | #316 | Tragic 8.4% |
| Immigrants | Guyana | 0.0 /100 | #317 | Tragic 8.5% |
| Guyanese | 0.0 /100 | #318 | Tragic 8.5% |
| Immigrants | Armenia | 0.0 /100 | #319 | Tragic 8.5% |
| Blacks/African Americans | 0.0 /100 | #320 | Tragic 8.6% |
Demographics Similar to Carpatho Rusyns by Unemployment Among Ages 25 to 29 years
In terms of unemployment among ages 25 to 29 years, the demographic groups most similar to Carpatho Rusyns are Belgian (6.3%, a difference of 0.020%), Immigrants from Jordan (6.3%, a difference of 0.070%), Immigrants from Korea (6.3%, a difference of 0.13%), Icelander (6.3%, a difference of 0.16%), and Asian (6.3%, a difference of 0.25%).
| Demographics | Rating | Rank | Unemployment Among Ages 25 to 29 years |
| Immigrants | Northern Africa | 97.8 /100 | #67 | Exceptional 6.3% |
| Palestinians | 97.7 /100 | #68 | Exceptional 6.3% |
| Immigrants | Hong Kong | 97.5 /100 | #69 | Exceptional 6.3% |
| Immigrants | Malaysia | 97.5 /100 | #70 | Exceptional 6.3% |
| Immigrants | France | 97.4 /100 | #71 | Exceptional 6.3% |
| Scandinavians | 97.4 /100 | #72 | Exceptional 6.3% |
| Belgians | 97.0 /100 | #73 | Exceptional 6.3% |
| Carpatho Rusyns | 96.9 /100 | #74 | Exceptional 6.3% |
| Immigrants | Jordan | 96.8 /100 | #75 | Exceptional 6.3% |
| Immigrants | Korea | 96.7 /100 | #76 | Exceptional 6.3% |
| Icelanders | 96.6 /100 | #77 | Exceptional 6.3% |
| Asians | 96.4 /100 | #78 | Exceptional 6.3% |
| Immigrants | Switzerland | 96.0 /100 | #79 | Exceptional 6.3% |
| Immigrants | Romania | 95.9 /100 | #80 | Exceptional 6.3% |
| Iranians | 95.8 /100 | #81 | Exceptional 6.3% |