Immigrants from Southern Europe vs Fijian Married-Couple Family Poverty
COMPARE
Immigrants from Southern Europe
Fijian
Married-Couple Family Poverty
Married-Couple Family Poverty Comparison
Immigrants from Southern Europe
Fijians
4.8%
MARRIED-COUPLE FAMILY POVERTY
93.4/ 100
METRIC RATING
120th/ 347
METRIC RANK
5.8%
MARRIED-COUPLE FAMILY POVERTY
2.5/ 100
METRIC RATING
240th/ 347
METRIC RANK
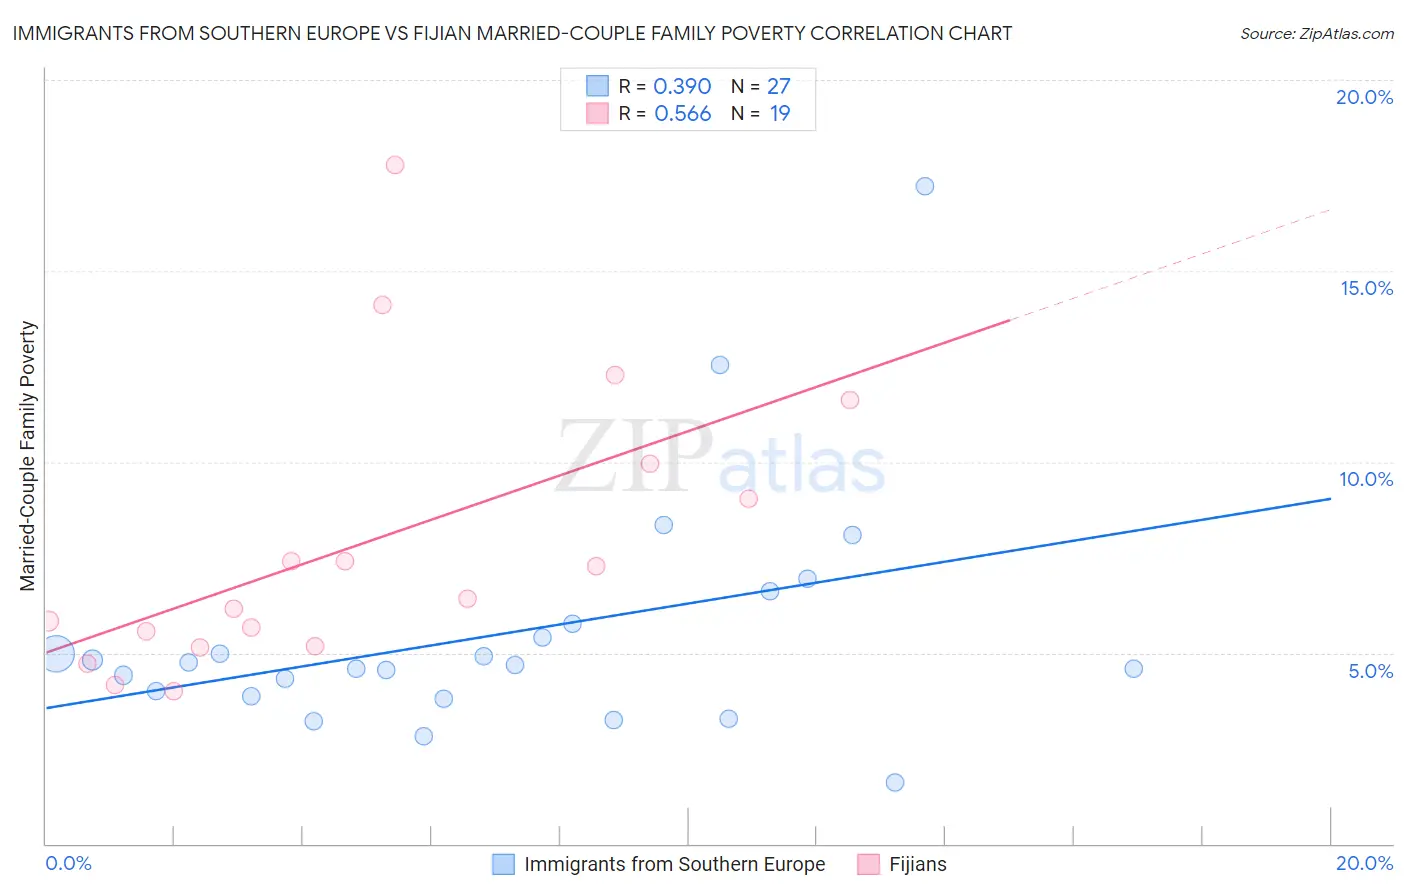
Immigrants from Southern Europe vs Fijian Married-Couple Family Poverty Correlation Chart
The statistical analysis conducted on geographies consisting of 398,530,737 people shows a mild positive correlation between the proportion of Immigrants from Southern Europe and poverty level among married-couple families in the United States with a correlation coefficient (R) of 0.390 and weighted average of 4.8%. Similarly, the statistical analysis conducted on geographies consisting of 55,857,947 people shows a substantial positive correlation between the proportion of Fijians and poverty level among married-couple families in the United States with a correlation coefficient (R) of 0.566 and weighted average of 5.8%, a difference of 19.9%.
Married-Couple Family Poverty Correlation Summary
| Measurement | Immigrants from Southern Europe | Fijian |
| Minimum | 1.6% | 4.0% |
| Maximum | 17.2% | 17.8% |
| Range | 15.6% | 13.8% |
| Mean | 5.5% | 7.9% |
| Median | 4.7% | 6.4% |
| Interquartile 25% (IQ1) | 3.9% | 5.2% |
| Interquartile 75% (IQ3) | 5.8% | 10.0% |
| Interquartile Range (IQR) | 1.9% | 4.8% |
| Standard Deviation (Sample) | 3.2% | 3.7% |
| Standard Deviation (Population) | 3.1% | 3.6% |
Similar Demographics by Married-Couple Family Poverty
Demographics Similar to Immigrants from Southern Europe by Married-Couple Family Poverty
In terms of married-couple family poverty, the demographic groups most similar to Immigrants from Southern Europe are Indian (Asian) (4.8%, a difference of 0.090%), White/Caucasian (4.8%, a difference of 0.14%), Jordanian (4.8%, a difference of 0.16%), Immigrants from Eastern Asia (4.8%, a difference of 0.32%), and Romanian (4.8%, a difference of 0.43%).
| Demographics | Rating | Rank | Married-Couple Family Poverty |
| Immigrants | Nepal | 95.9 /100 | #113 | Exceptional 4.7% |
| Immigrants | Indonesia | 95.1 /100 | #114 | Exceptional 4.8% |
| Taiwanese | 94.8 /100 | #115 | Exceptional 4.8% |
| Celtics | 94.8 /100 | #116 | Exceptional 4.8% |
| Kenyans | 94.7 /100 | #117 | Exceptional 4.8% |
| Immigrants | Philippines | 94.6 /100 | #118 | Exceptional 4.8% |
| Immigrants | Eastern Asia | 94.0 /100 | #119 | Exceptional 4.8% |
| Immigrants | Southern Europe | 93.4 /100 | #120 | Exceptional 4.8% |
| Indians (Asian) | 93.2 /100 | #121 | Exceptional 4.8% |
| Whites/Caucasians | 93.1 /100 | #122 | Exceptional 4.8% |
| Jordanians | 93.1 /100 | #123 | Exceptional 4.8% |
| Romanians | 92.5 /100 | #124 | Exceptional 4.8% |
| Immigrants | Bosnia and Herzegovina | 92.5 /100 | #125 | Exceptional 4.8% |
| Immigrants | Asia | 92.3 /100 | #126 | Exceptional 4.8% |
| Egyptians | 92.0 /100 | #127 | Exceptional 4.8% |
Demographics Similar to Fijians by Married-Couple Family Poverty
In terms of married-couple family poverty, the demographic groups most similar to Fijians are Immigrants from Panama (5.8%, a difference of 0.020%), Immigrants from Western Africa (5.8%, a difference of 0.11%), Venezuelan (5.8%, a difference of 0.17%), Cherokee (5.8%, a difference of 0.19%), and Somali (5.8%, a difference of 0.27%).
| Demographics | Rating | Rank | Married-Couple Family Poverty |
| Immigrants | Colombia | 3.7 /100 | #233 | Tragic 5.7% |
| Immigrants | Uruguay | 3.7 /100 | #234 | Tragic 5.7% |
| Immigrants | Sudan | 3.5 /100 | #235 | Tragic 5.7% |
| Ghanaians | 3.3 /100 | #236 | Tragic 5.7% |
| Immigrants | South America | 3.1 /100 | #237 | Tragic 5.7% |
| Cherokee | 2.7 /100 | #238 | Tragic 5.8% |
| Venezuelans | 2.7 /100 | #239 | Tragic 5.8% |
| Fijians | 2.5 /100 | #240 | Tragic 5.8% |
| Immigrants | Panama | 2.5 /100 | #241 | Tragic 5.8% |
| Immigrants | Western Africa | 2.4 /100 | #242 | Tragic 5.8% |
| Somalis | 2.3 /100 | #243 | Tragic 5.8% |
| Chickasaw | 2.3 /100 | #244 | Tragic 5.8% |
| Immigrants | Afghanistan | 2.1 /100 | #245 | Tragic 5.8% |
| Immigrants | Venezuela | 1.8 /100 | #246 | Tragic 5.8% |
| Iraqis | 1.4 /100 | #247 | Tragic 5.9% |