Immigrants from Southern Europe vs Chippewa Poverty
COMPARE
Immigrants from Southern Europe
Chippewa
Poverty
Poverty Comparison
Immigrants from Southern Europe
Chippewa
11.6%
POVERTY
90.8/ 100
METRIC RATING
112th/ 347
METRIC RANK
15.7%
POVERTY
0.0/ 100
METRIC RATING
311th/ 347
METRIC RANK
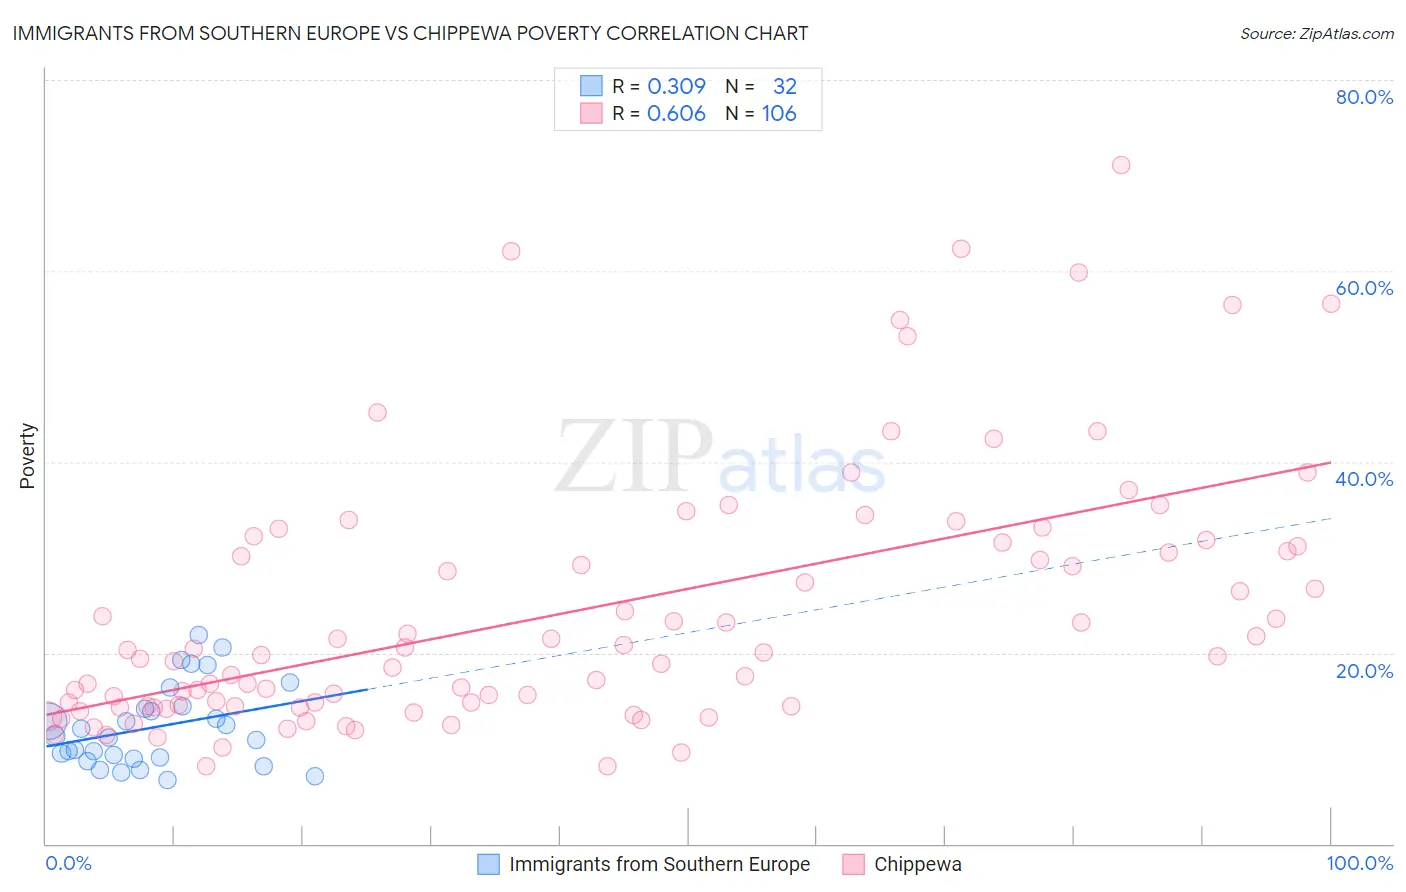
Immigrants from Southern Europe vs Chippewa Poverty Correlation Chart
The statistical analysis conducted on geographies consisting of 402,613,085 people shows a mild positive correlation between the proportion of Immigrants from Southern Europe and poverty level in the United States with a correlation coefficient (R) of 0.309 and weighted average of 11.6%. Similarly, the statistical analysis conducted on geographies consisting of 215,014,776 people shows a significant positive correlation between the proportion of Chippewa and poverty level in the United States with a correlation coefficient (R) of 0.606 and weighted average of 15.7%, a difference of 34.8%.
Poverty Correlation Summary
| Measurement | Immigrants from Southern Europe | Chippewa |
| Minimum | 6.6% | 8.1% |
| Maximum | 21.8% | 71.1% |
| Range | 15.2% | 63.0% |
| Mean | 12.2% | 24.2% |
| Median | 11.2% | 19.7% |
| Interquartile 25% (IQ1) | 9.0% | 14.4% |
| Interquartile 75% (IQ3) | 14.3% | 31.1% |
| Interquartile Range (IQR) | 5.3% | 16.7% |
| Standard Deviation (Sample) | 4.3% | 13.5% |
| Standard Deviation (Population) | 4.2% | 13.4% |
Similar Demographics by Poverty
Demographics Similar to Immigrants from Southern Europe by Poverty
In terms of poverty, the demographic groups most similar to Immigrants from Southern Europe are Immigrants from Belarus (11.6%, a difference of 0.0%), Immigrants from China (11.6%, a difference of 0.020%), French Canadian (11.6%, a difference of 0.070%), Albanian (11.7%, a difference of 0.16%), and Welsh (11.6%, a difference of 0.23%).
| Demographics | Rating | Rank | Poverty |
| Portuguese | 92.1 /100 | #105 | Exceptional 11.6% |
| Immigrants | Zimbabwe | 92.1 /100 | #106 | Exceptional 11.6% |
| Palestinians | 91.8 /100 | #107 | Exceptional 11.6% |
| Canadians | 91.7 /100 | #108 | Exceptional 11.6% |
| Immigrants | Turkey | 91.7 /100 | #109 | Exceptional 11.6% |
| Welsh | 91.6 /100 | #110 | Exceptional 11.6% |
| French Canadians | 91.0 /100 | #111 | Exceptional 11.6% |
| Immigrants | Southern Europe | 90.8 /100 | #112 | Exceptional 11.6% |
| Immigrants | Belarus | 90.8 /100 | #113 | Exceptional 11.6% |
| Immigrants | China | 90.7 /100 | #114 | Exceptional 11.6% |
| Albanians | 90.3 /100 | #115 | Exceptional 11.7% |
| Immigrants | Russia | 89.7 /100 | #116 | Excellent 11.7% |
| Sri Lankans | 89.4 /100 | #117 | Excellent 11.7% |
| Argentineans | 89.1 /100 | #118 | Excellent 11.7% |
| Tlingit-Haida | 89.0 /100 | #119 | Excellent 11.7% |
Demographics Similar to Chippewa by Poverty
In terms of poverty, the demographic groups most similar to Chippewa are Cajun (15.7%, a difference of 0.16%), Dutch West Indian (15.6%, a difference of 0.39%), Seminole (15.6%, a difference of 0.48%), Choctaw (15.6%, a difference of 0.52%), and Immigrants from Grenada (15.8%, a difference of 0.60%).
| Demographics | Rating | Rank | Poverty |
| Immigrants | Mexico | 0.0 /100 | #304 | Tragic 15.5% |
| Immigrants | Guatemala | 0.0 /100 | #305 | Tragic 15.5% |
| Creek | 0.0 /100 | #306 | Tragic 15.6% |
| Africans | 0.0 /100 | #307 | Tragic 15.6% |
| Choctaw | 0.0 /100 | #308 | Tragic 15.6% |
| Seminole | 0.0 /100 | #309 | Tragic 15.6% |
| Dutch West Indians | 0.0 /100 | #310 | Tragic 15.6% |
| Chippewa | 0.0 /100 | #311 | Tragic 15.7% |
| Cajuns | 0.0 /100 | #312 | Tragic 15.7% |
| Immigrants | Grenada | 0.0 /100 | #313 | Tragic 15.8% |
| Immigrants | Somalia | 0.0 /100 | #314 | Tragic 15.8% |
| British West Indians | 0.0 /100 | #315 | Tragic 15.9% |
| Hondurans | 0.0 /100 | #316 | Tragic 15.9% |
| U.S. Virgin Islanders | 0.0 /100 | #317 | Tragic 16.1% |
| Immigrants | Dominica | 0.0 /100 | #318 | Tragic 16.1% |