Immigrants from Southern Europe vs Japanese Poverty
COMPARE
Immigrants from Southern Europe
Japanese
Poverty
Poverty Comparison
Immigrants from Southern Europe
Japanese
11.6%
POVERTY
90.8/ 100
METRIC RATING
112th/ 347
METRIC RANK
13.3%
POVERTY
3.3/ 100
METRIC RATING
215th/ 347
METRIC RANK
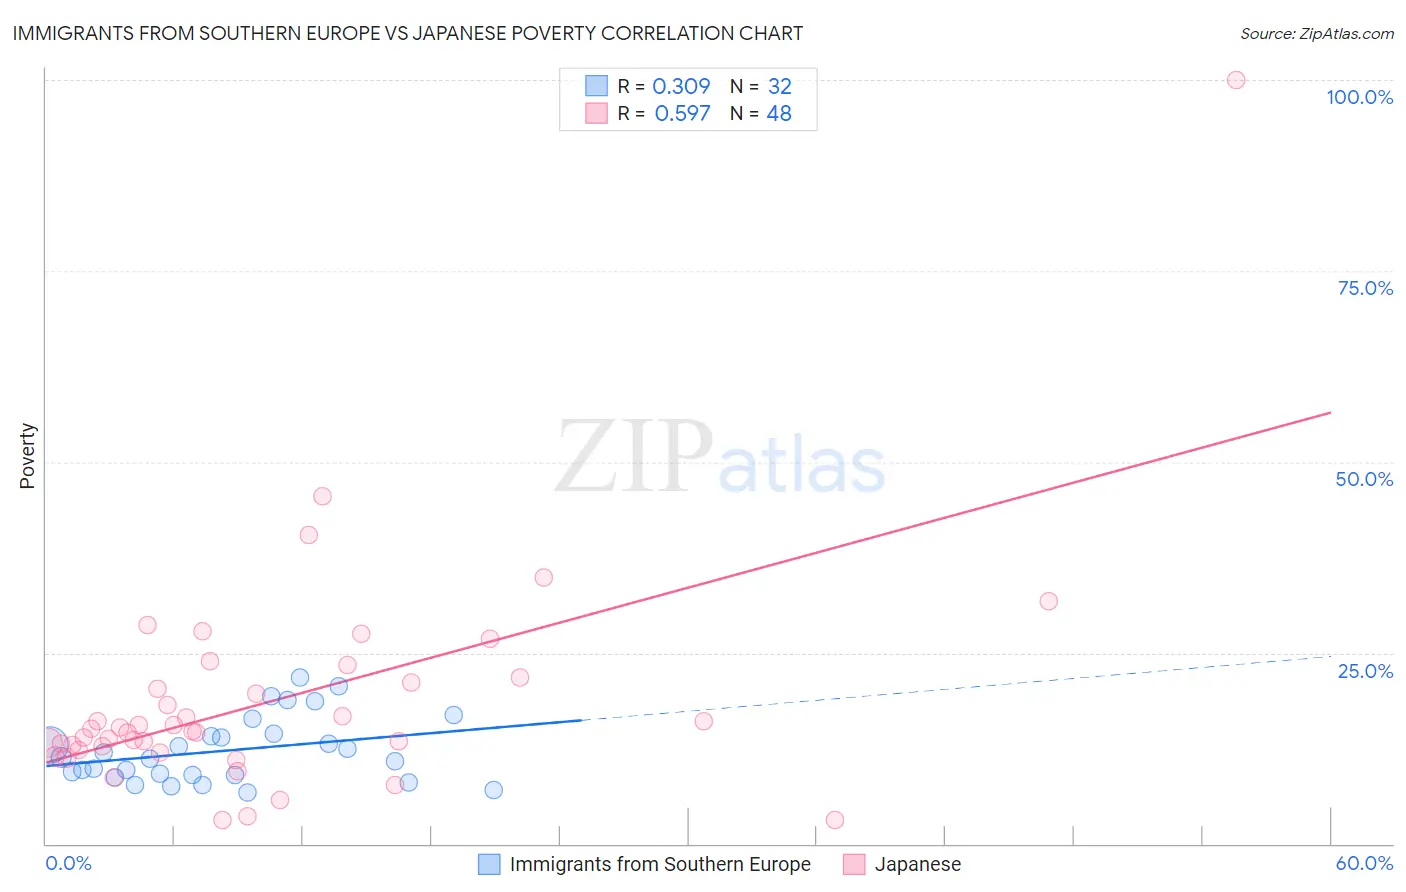
Immigrants from Southern Europe vs Japanese Poverty Correlation Chart
The statistical analysis conducted on geographies consisting of 402,613,085 people shows a mild positive correlation between the proportion of Immigrants from Southern Europe and poverty level in the United States with a correlation coefficient (R) of 0.309 and weighted average of 11.6%. Similarly, the statistical analysis conducted on geographies consisting of 249,091,915 people shows a substantial positive correlation between the proportion of Japanese and poverty level in the United States with a correlation coefficient (R) of 0.597 and weighted average of 13.3%, a difference of 14.5%.
Poverty Correlation Summary
| Measurement | Immigrants from Southern Europe | Japanese |
| Minimum | 6.6% | 3.1% |
| Maximum | 21.8% | 100.0% |
| Range | 15.2% | 96.9% |
| Mean | 12.2% | 18.8% |
| Median | 11.2% | 14.9% |
| Interquartile 25% (IQ1) | 9.0% | 12.5% |
| Interquartile 75% (IQ3) | 14.3% | 21.4% |
| Interquartile Range (IQR) | 5.3% | 8.9% |
| Standard Deviation (Sample) | 4.3% | 14.9% |
| Standard Deviation (Population) | 4.2% | 14.8% |
Similar Demographics by Poverty
Demographics Similar to Immigrants from Southern Europe by Poverty
In terms of poverty, the demographic groups most similar to Immigrants from Southern Europe are Immigrants from Belarus (11.6%, a difference of 0.0%), Immigrants from China (11.6%, a difference of 0.020%), French Canadian (11.6%, a difference of 0.070%), Albanian (11.7%, a difference of 0.16%), and Welsh (11.6%, a difference of 0.23%).
| Demographics | Rating | Rank | Poverty |
| Portuguese | 92.1 /100 | #105 | Exceptional 11.6% |
| Immigrants | Zimbabwe | 92.1 /100 | #106 | Exceptional 11.6% |
| Palestinians | 91.8 /100 | #107 | Exceptional 11.6% |
| Canadians | 91.7 /100 | #108 | Exceptional 11.6% |
| Immigrants | Turkey | 91.7 /100 | #109 | Exceptional 11.6% |
| Welsh | 91.6 /100 | #110 | Exceptional 11.6% |
| French Canadians | 91.0 /100 | #111 | Exceptional 11.6% |
| Immigrants | Southern Europe | 90.8 /100 | #112 | Exceptional 11.6% |
| Immigrants | Belarus | 90.8 /100 | #113 | Exceptional 11.6% |
| Immigrants | China | 90.7 /100 | #114 | Exceptional 11.6% |
| Albanians | 90.3 /100 | #115 | Exceptional 11.7% |
| Immigrants | Russia | 89.7 /100 | #116 | Excellent 11.7% |
| Sri Lankans | 89.4 /100 | #117 | Excellent 11.7% |
| Argentineans | 89.1 /100 | #118 | Excellent 11.7% |
| Tlingit-Haida | 89.0 /100 | #119 | Excellent 11.7% |
Demographics Similar to Japanese by Poverty
In terms of poverty, the demographic groups most similar to Japanese are Nonimmigrants (13.3%, a difference of 0.0%), Immigrants from Uzbekistan (13.3%, a difference of 0.040%), Immigrants from Thailand (13.3%, a difference of 0.10%), Immigrants from Cambodia (13.4%, a difference of 0.23%), and Bermudan (13.3%, a difference of 0.26%).
| Demographics | Rating | Rank | Poverty |
| Ugandans | 6.2 /100 | #208 | Tragic 13.1% |
| Malaysians | 6.1 /100 | #209 | Tragic 13.1% |
| Immigrants | Azores | 6.1 /100 | #210 | Tragic 13.1% |
| Moroccans | 5.2 /100 | #211 | Tragic 13.2% |
| Immigrants | Immigrants | 4.3 /100 | #212 | Tragic 13.2% |
| Immigrants | Panama | 4.1 /100 | #213 | Tragic 13.3% |
| Bermudans | 3.7 /100 | #214 | Tragic 13.3% |
| Japanese | 3.3 /100 | #215 | Tragic 13.3% |
| Immigrants | Nonimmigrants | 3.3 /100 | #216 | Tragic 13.3% |
| Immigrants | Uzbekistan | 3.2 /100 | #217 | Tragic 13.3% |
| Immigrants | Thailand | 3.1 /100 | #218 | Tragic 13.3% |
| Immigrants | Cambodia | 3.0 /100 | #219 | Tragic 13.4% |
| Americans | 2.9 /100 | #220 | Tragic 13.4% |
| Alsatians | 2.6 /100 | #221 | Tragic 13.4% |
| Immigrants | Micronesia | 2.6 /100 | #222 | Tragic 13.4% |