Malaysian vs Chippewa Poverty
COMPARE
Malaysian
Chippewa
Poverty
Poverty Comparison
Malaysians
Chippewa
13.1%
POVERTY
6.1/ 100
METRIC RATING
209th/ 347
METRIC RANK
15.7%
POVERTY
0.0/ 100
METRIC RATING
311th/ 347
METRIC RANK
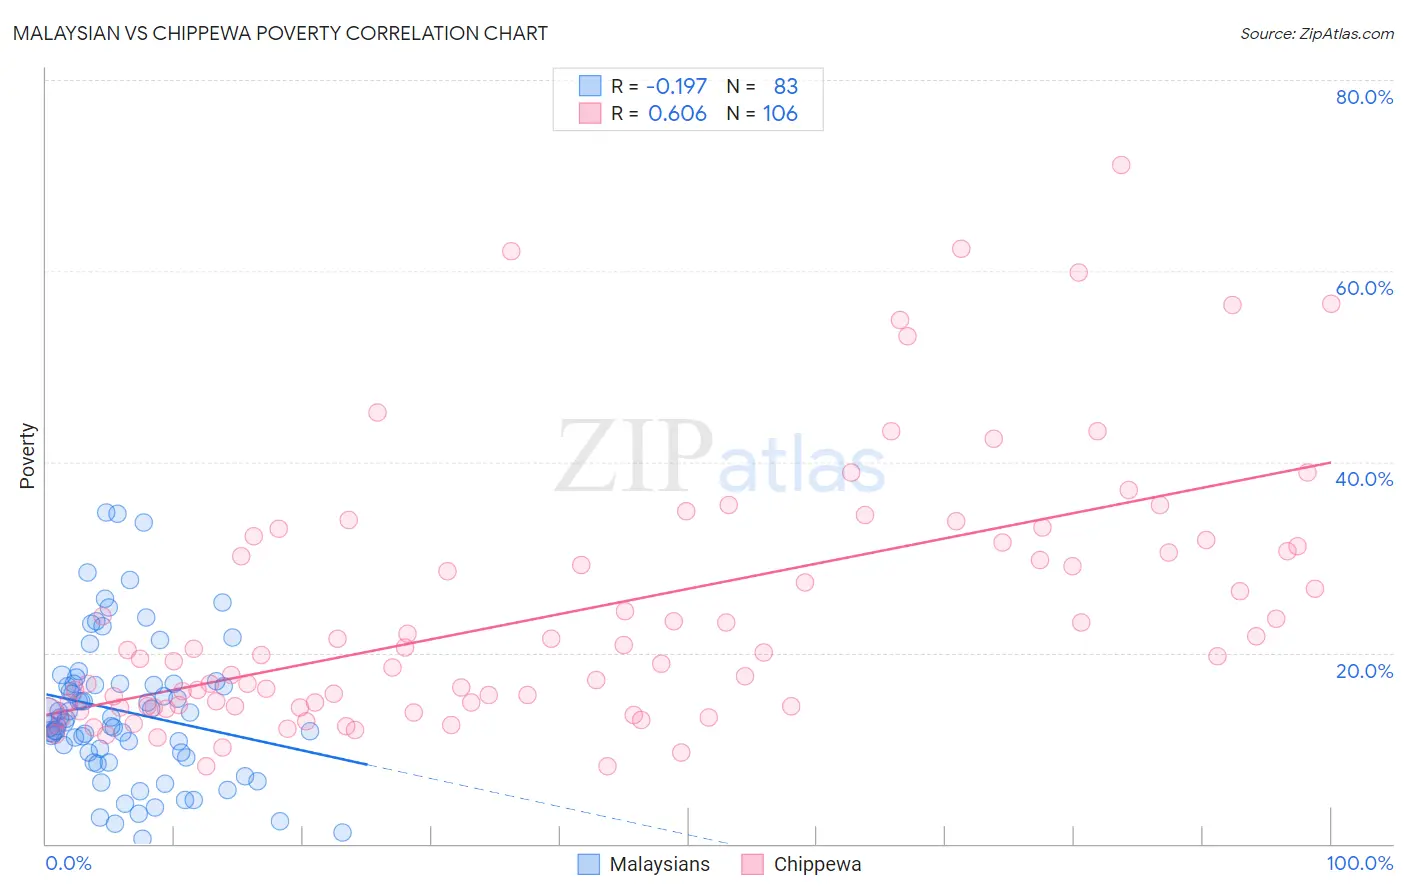
Malaysian vs Chippewa Poverty Correlation Chart
The statistical analysis conducted on geographies consisting of 226,011,043 people shows a poor negative correlation between the proportion of Malaysians and poverty level in the United States with a correlation coefficient (R) of -0.197 and weighted average of 13.1%. Similarly, the statistical analysis conducted on geographies consisting of 215,014,776 people shows a significant positive correlation between the proportion of Chippewa and poverty level in the United States with a correlation coefficient (R) of 0.606 and weighted average of 15.7%, a difference of 19.4%.
Poverty Correlation Summary
| Measurement | Malaysian | Chippewa |
| Minimum | 0.56% | 8.1% |
| Maximum | 34.7% | 71.1% |
| Range | 34.2% | 63.0% |
| Mean | 13.8% | 24.2% |
| Median | 13.1% | 19.7% |
| Interquartile 25% (IQ1) | 9.6% | 14.4% |
| Interquartile 75% (IQ3) | 16.7% | 31.1% |
| Interquartile Range (IQR) | 7.1% | 16.7% |
| Standard Deviation (Sample) | 7.4% | 13.5% |
| Standard Deviation (Population) | 7.4% | 13.4% |
Similar Demographics by Poverty
Demographics Similar to Malaysians by Poverty
In terms of poverty, the demographic groups most similar to Malaysians are Ugandan (13.1%, a difference of 0.030%), Immigrants from the Azores (13.1%, a difference of 0.030%), Panamanian (13.1%, a difference of 0.18%), Immigrants from Eastern Africa (13.1%, a difference of 0.30%), and Moroccan (13.2%, a difference of 0.38%).
| Demographics | Rating | Rank | Poverty |
| Immigrants | Uruguay | 15.6 /100 | #202 | Poor 12.8% |
| Hmong | 15.0 /100 | #203 | Poor 12.8% |
| Immigrants | Western Asia | 14.1 /100 | #204 | Poor 12.9% |
| Tsimshian | 9.2 /100 | #205 | Tragic 13.0% |
| Immigrants | Eastern Africa | 7.0 /100 | #206 | Tragic 13.1% |
| Panamanians | 6.6 /100 | #207 | Tragic 13.1% |
| Ugandans | 6.2 /100 | #208 | Tragic 13.1% |
| Malaysians | 6.1 /100 | #209 | Tragic 13.1% |
| Immigrants | Azores | 6.1 /100 | #210 | Tragic 13.1% |
| Moroccans | 5.2 /100 | #211 | Tragic 13.2% |
| Immigrants | Immigrants | 4.3 /100 | #212 | Tragic 13.2% |
| Immigrants | Panama | 4.1 /100 | #213 | Tragic 13.3% |
| Bermudans | 3.7 /100 | #214 | Tragic 13.3% |
| Japanese | 3.3 /100 | #215 | Tragic 13.3% |
| Immigrants | Nonimmigrants | 3.3 /100 | #216 | Tragic 13.3% |
Demographics Similar to Chippewa by Poverty
In terms of poverty, the demographic groups most similar to Chippewa are Cajun (15.7%, a difference of 0.16%), Dutch West Indian (15.6%, a difference of 0.39%), Seminole (15.6%, a difference of 0.48%), Choctaw (15.6%, a difference of 0.52%), and Immigrants from Grenada (15.8%, a difference of 0.60%).
| Demographics | Rating | Rank | Poverty |
| Immigrants | Mexico | 0.0 /100 | #304 | Tragic 15.5% |
| Immigrants | Guatemala | 0.0 /100 | #305 | Tragic 15.5% |
| Creek | 0.0 /100 | #306 | Tragic 15.6% |
| Africans | 0.0 /100 | #307 | Tragic 15.6% |
| Choctaw | 0.0 /100 | #308 | Tragic 15.6% |
| Seminole | 0.0 /100 | #309 | Tragic 15.6% |
| Dutch West Indians | 0.0 /100 | #310 | Tragic 15.6% |
| Chippewa | 0.0 /100 | #311 | Tragic 15.7% |
| Cajuns | 0.0 /100 | #312 | Tragic 15.7% |
| Immigrants | Grenada | 0.0 /100 | #313 | Tragic 15.8% |
| Immigrants | Somalia | 0.0 /100 | #314 | Tragic 15.8% |
| British West Indians | 0.0 /100 | #315 | Tragic 15.9% |
| Hondurans | 0.0 /100 | #316 | Tragic 15.9% |
| U.S. Virgin Islanders | 0.0 /100 | #317 | Tragic 16.1% |
| Immigrants | Dominica | 0.0 /100 | #318 | Tragic 16.1% |