Immigrants from Southern Europe vs Spanish American Poverty
COMPARE
Immigrants from Southern Europe
Spanish American
Poverty
Poverty Comparison
Immigrants from Southern Europe
Spanish Americans
11.6%
POVERTY
90.8/ 100
METRIC RATING
112th/ 347
METRIC RANK
14.7%
POVERTY
0.0/ 100
METRIC RATING
273rd/ 347
METRIC RANK
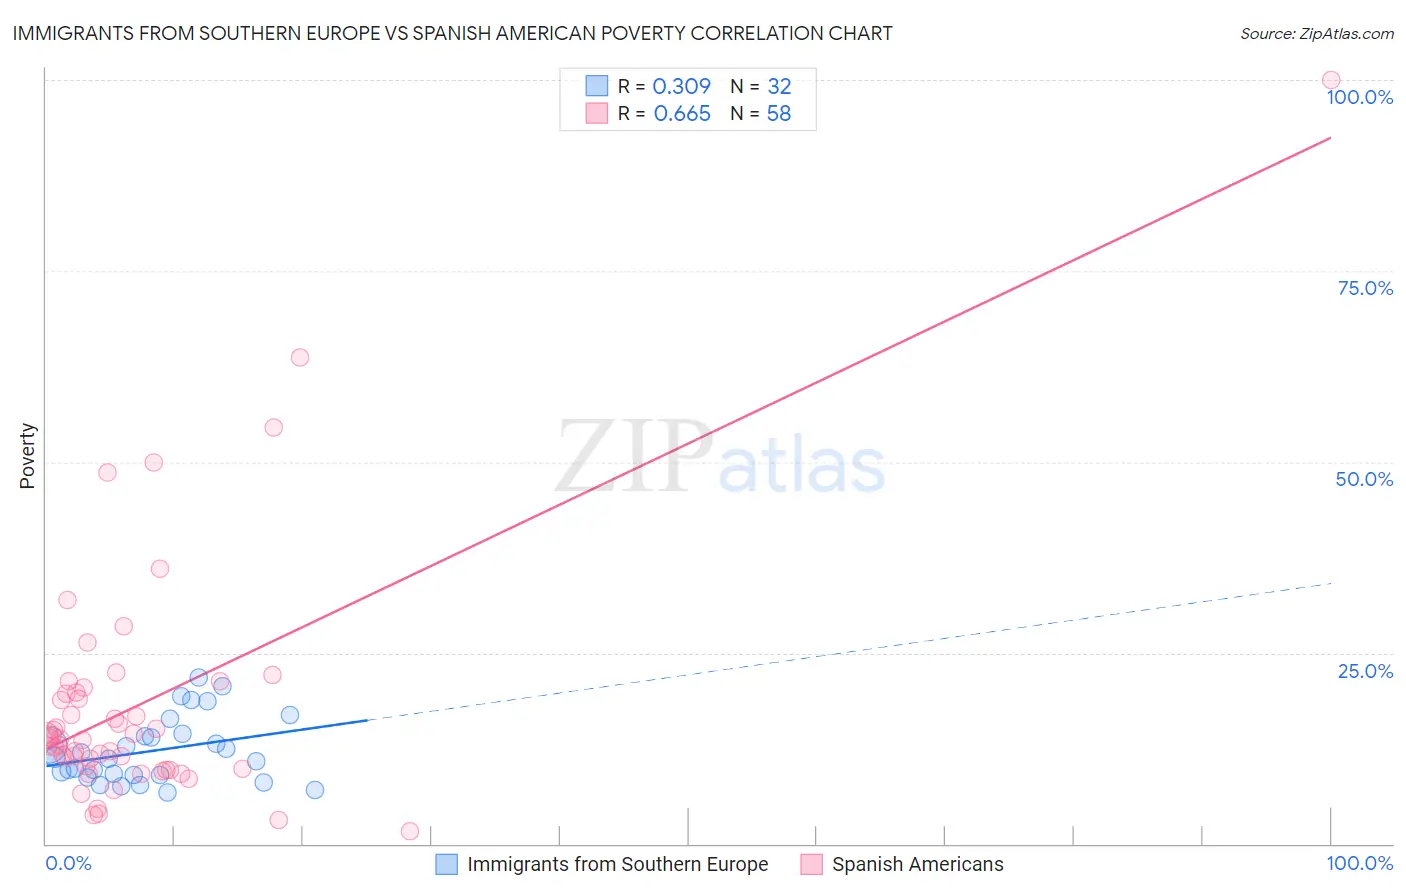
Immigrants from Southern Europe vs Spanish American Poverty Correlation Chart
The statistical analysis conducted on geographies consisting of 402,613,085 people shows a mild positive correlation between the proportion of Immigrants from Southern Europe and poverty level in the United States with a correlation coefficient (R) of 0.309 and weighted average of 11.6%. Similarly, the statistical analysis conducted on geographies consisting of 103,164,738 people shows a significant positive correlation between the proportion of Spanish Americans and poverty level in the United States with a correlation coefficient (R) of 0.665 and weighted average of 14.7%, a difference of 26.8%.
Poverty Correlation Summary
| Measurement | Immigrants from Southern Europe | Spanish American |
| Minimum | 6.6% | 1.6% |
| Maximum | 21.8% | 100.0% |
| Range | 15.2% | 98.4% |
| Mean | 12.2% | 18.4% |
| Median | 11.2% | 13.8% |
| Interquartile 25% (IQ1) | 9.0% | 9.8% |
| Interquartile 75% (IQ3) | 14.3% | 19.8% |
| Interquartile Range (IQR) | 5.3% | 10.0% |
| Standard Deviation (Sample) | 4.3% | 16.4% |
| Standard Deviation (Population) | 4.2% | 16.3% |
Similar Demographics by Poverty
Demographics Similar to Immigrants from Southern Europe by Poverty
In terms of poverty, the demographic groups most similar to Immigrants from Southern Europe are Immigrants from Belarus (11.6%, a difference of 0.0%), Immigrants from China (11.6%, a difference of 0.020%), French Canadian (11.6%, a difference of 0.070%), Albanian (11.7%, a difference of 0.16%), and Welsh (11.6%, a difference of 0.23%).
| Demographics | Rating | Rank | Poverty |
| Portuguese | 92.1 /100 | #105 | Exceptional 11.6% |
| Immigrants | Zimbabwe | 92.1 /100 | #106 | Exceptional 11.6% |
| Palestinians | 91.8 /100 | #107 | Exceptional 11.6% |
| Canadians | 91.7 /100 | #108 | Exceptional 11.6% |
| Immigrants | Turkey | 91.7 /100 | #109 | Exceptional 11.6% |
| Welsh | 91.6 /100 | #110 | Exceptional 11.6% |
| French Canadians | 91.0 /100 | #111 | Exceptional 11.6% |
| Immigrants | Southern Europe | 90.8 /100 | #112 | Exceptional 11.6% |
| Immigrants | Belarus | 90.8 /100 | #113 | Exceptional 11.6% |
| Immigrants | China | 90.7 /100 | #114 | Exceptional 11.6% |
| Albanians | 90.3 /100 | #115 | Exceptional 11.7% |
| Immigrants | Russia | 89.7 /100 | #116 | Excellent 11.7% |
| Sri Lankans | 89.4 /100 | #117 | Excellent 11.7% |
| Argentineans | 89.1 /100 | #118 | Excellent 11.7% |
| Tlingit-Haida | 89.0 /100 | #119 | Excellent 11.7% |
Demographics Similar to Spanish Americans by Poverty
In terms of poverty, the demographic groups most similar to Spanish Americans are Barbadian (14.8%, a difference of 0.39%), Immigrants from West Indies (14.8%, a difference of 0.43%), Immigrants from Bahamas (14.8%, a difference of 0.43%), Bangladeshi (14.8%, a difference of 0.48%), and Belizean (14.8%, a difference of 0.50%).
| Demographics | Rating | Rank | Poverty |
| Guyanese | 0.1 /100 | #266 | Tragic 14.5% |
| Iroquois | 0.1 /100 | #267 | Tragic 14.5% |
| Sub-Saharan Africans | 0.1 /100 | #268 | Tragic 14.5% |
| Immigrants | Cuba | 0.1 /100 | #269 | Tragic 14.6% |
| Central Americans | 0.1 /100 | #270 | Tragic 14.6% |
| Shoshone | 0.0 /100 | #271 | Tragic 14.7% |
| Chickasaw | 0.0 /100 | #272 | Tragic 14.7% |
| Spanish Americans | 0.0 /100 | #273 | Tragic 14.7% |
| Barbadians | 0.0 /100 | #274 | Tragic 14.8% |
| Immigrants | West Indies | 0.0 /100 | #275 | Tragic 14.8% |
| Immigrants | Bahamas | 0.0 /100 | #276 | Tragic 14.8% |
| Bangladeshis | 0.0 /100 | #277 | Tragic 14.8% |
| Belizeans | 0.0 /100 | #278 | Tragic 14.8% |
| Immigrants | St. Vincent and the Grenadines | 0.0 /100 | #279 | Tragic 14.9% |
| Haitians | 0.0 /100 | #280 | Tragic 14.9% |