Immigrants from Netherlands vs Chippewa Poverty
COMPARE
Immigrants from Netherlands
Chippewa
Poverty
Poverty Comparison
Immigrants from Netherlands
Chippewa
11.2%
POVERTY
97.5/ 100
METRIC RATING
66th/ 347
METRIC RANK
15.7%
POVERTY
0.0/ 100
METRIC RATING
311th/ 347
METRIC RANK
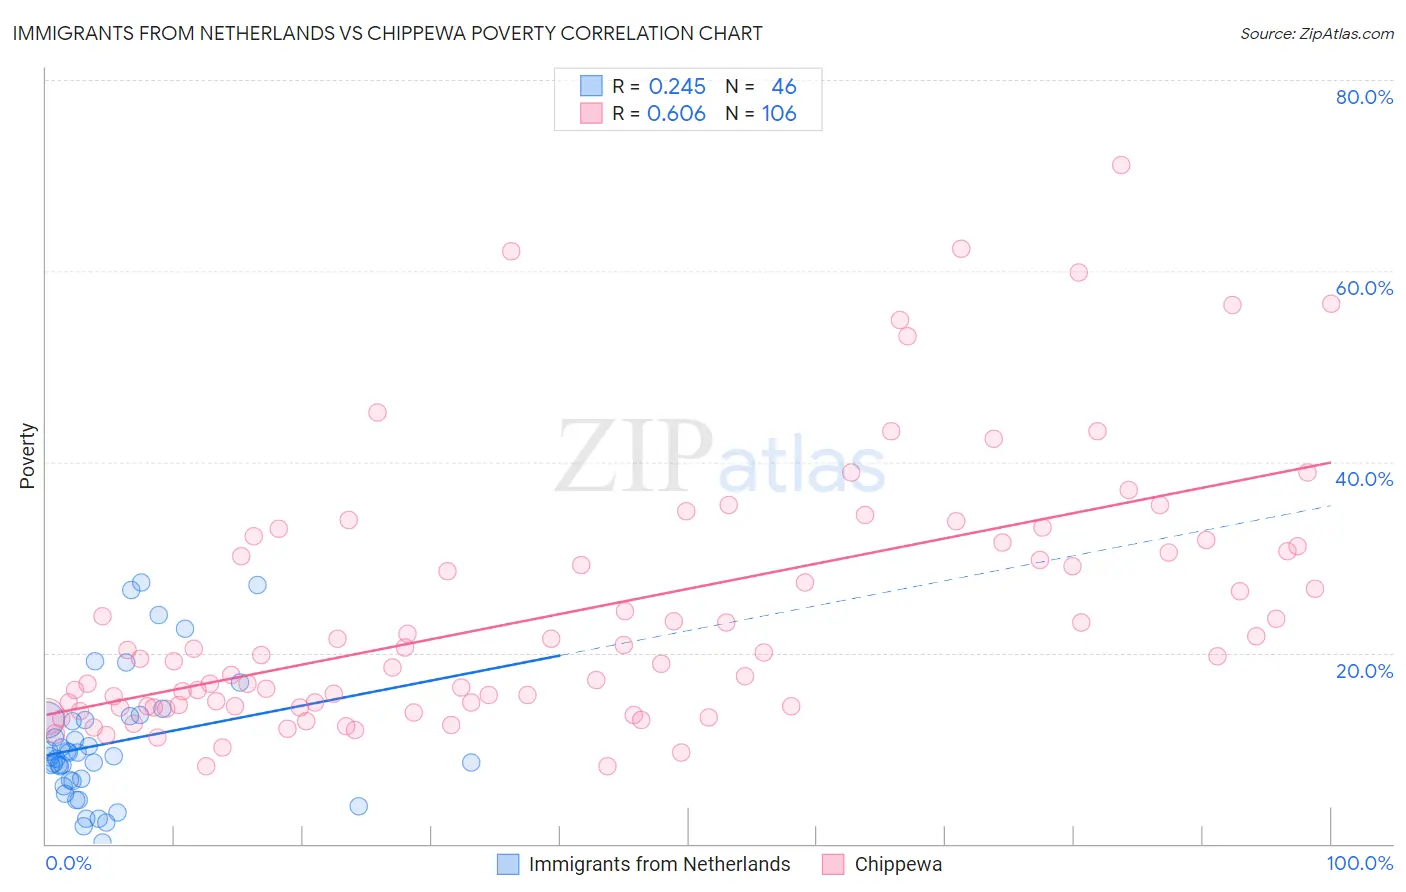
Immigrants from Netherlands vs Chippewa Poverty Correlation Chart
The statistical analysis conducted on geographies consisting of 237,819,327 people shows a weak positive correlation between the proportion of Immigrants from Netherlands and poverty level in the United States with a correlation coefficient (R) of 0.245 and weighted average of 11.2%. Similarly, the statistical analysis conducted on geographies consisting of 215,014,776 people shows a significant positive correlation between the proportion of Chippewa and poverty level in the United States with a correlation coefficient (R) of 0.606 and weighted average of 15.7%, a difference of 39.7%.
Poverty Correlation Summary
| Measurement | Immigrants from Netherlands | Chippewa |
| Minimum | 0.13% | 8.1% |
| Maximum | 27.4% | 71.1% |
| Range | 27.2% | 63.0% |
| Mean | 10.6% | 24.2% |
| Median | 9.2% | 19.7% |
| Interquartile 25% (IQ1) | 6.6% | 14.4% |
| Interquartile 75% (IQ3) | 13.0% | 31.1% |
| Interquartile Range (IQR) | 6.4% | 16.7% |
| Standard Deviation (Sample) | 6.8% | 13.5% |
| Standard Deviation (Population) | 6.7% | 13.4% |
Similar Demographics by Poverty
Demographics Similar to Immigrants from Netherlands by Poverty
In terms of poverty, the demographic groups most similar to Immigrants from Netherlands are Immigrants from Australia (11.2%, a difference of 0.040%), Slovak (11.2%, a difference of 0.060%), Immigrants from Asia (11.2%, a difference of 0.070%), Serbian (11.2%, a difference of 0.12%), and Swiss (11.2%, a difference of 0.20%).
| Demographics | Rating | Rank | Poverty |
| Immigrants | Europe | 98.0 /100 | #59 | Exceptional 11.2% |
| Immigrants | Sri Lanka | 97.9 /100 | #60 | Exceptional 11.2% |
| Immigrants | Italy | 97.9 /100 | #61 | Exceptional 11.2% |
| Austrians | 97.8 /100 | #62 | Exceptional 11.2% |
| Ukrainians | 97.8 /100 | #63 | Exceptional 11.2% |
| Swiss | 97.7 /100 | #64 | Exceptional 11.2% |
| Immigrants | Asia | 97.5 /100 | #65 | Exceptional 11.2% |
| Immigrants | Netherlands | 97.5 /100 | #66 | Exceptional 11.2% |
| Immigrants | Australia | 97.4 /100 | #67 | Exceptional 11.2% |
| Slovaks | 97.4 /100 | #68 | Exceptional 11.2% |
| Serbians | 97.4 /100 | #69 | Exceptional 11.2% |
| Immigrants | Canada | 97.3 /100 | #70 | Exceptional 11.3% |
| Zimbabweans | 97.3 /100 | #71 | Exceptional 11.3% |
| Europeans | 97.2 /100 | #72 | Exceptional 11.3% |
| Immigrants | Belgium | 97.2 /100 | #73 | Exceptional 11.3% |
Demographics Similar to Chippewa by Poverty
In terms of poverty, the demographic groups most similar to Chippewa are Cajun (15.7%, a difference of 0.16%), Dutch West Indian (15.6%, a difference of 0.39%), Seminole (15.6%, a difference of 0.48%), Choctaw (15.6%, a difference of 0.52%), and Immigrants from Grenada (15.8%, a difference of 0.60%).
| Demographics | Rating | Rank | Poverty |
| Immigrants | Mexico | 0.0 /100 | #304 | Tragic 15.5% |
| Immigrants | Guatemala | 0.0 /100 | #305 | Tragic 15.5% |
| Creek | 0.0 /100 | #306 | Tragic 15.6% |
| Africans | 0.0 /100 | #307 | Tragic 15.6% |
| Choctaw | 0.0 /100 | #308 | Tragic 15.6% |
| Seminole | 0.0 /100 | #309 | Tragic 15.6% |
| Dutch West Indians | 0.0 /100 | #310 | Tragic 15.6% |
| Chippewa | 0.0 /100 | #311 | Tragic 15.7% |
| Cajuns | 0.0 /100 | #312 | Tragic 15.7% |
| Immigrants | Grenada | 0.0 /100 | #313 | Tragic 15.8% |
| Immigrants | Somalia | 0.0 /100 | #314 | Tragic 15.8% |
| British West Indians | 0.0 /100 | #315 | Tragic 15.9% |
| Hondurans | 0.0 /100 | #316 | Tragic 15.9% |
| U.S. Virgin Islanders | 0.0 /100 | #317 | Tragic 16.1% |
| Immigrants | Dominica | 0.0 /100 | #318 | Tragic 16.1% |