Immigrants from Southern Europe vs Immigrants from Ukraine Poverty
COMPARE
Immigrants from Southern Europe
Immigrants from Ukraine
Poverty
Poverty Comparison
Immigrants from Southern Europe
Immigrants from Ukraine
11.6%
POVERTY
90.8/ 100
METRIC RATING
112th/ 347
METRIC RANK
11.8%
POVERTY
86.6/ 100
METRIC RATING
130th/ 347
METRIC RANK
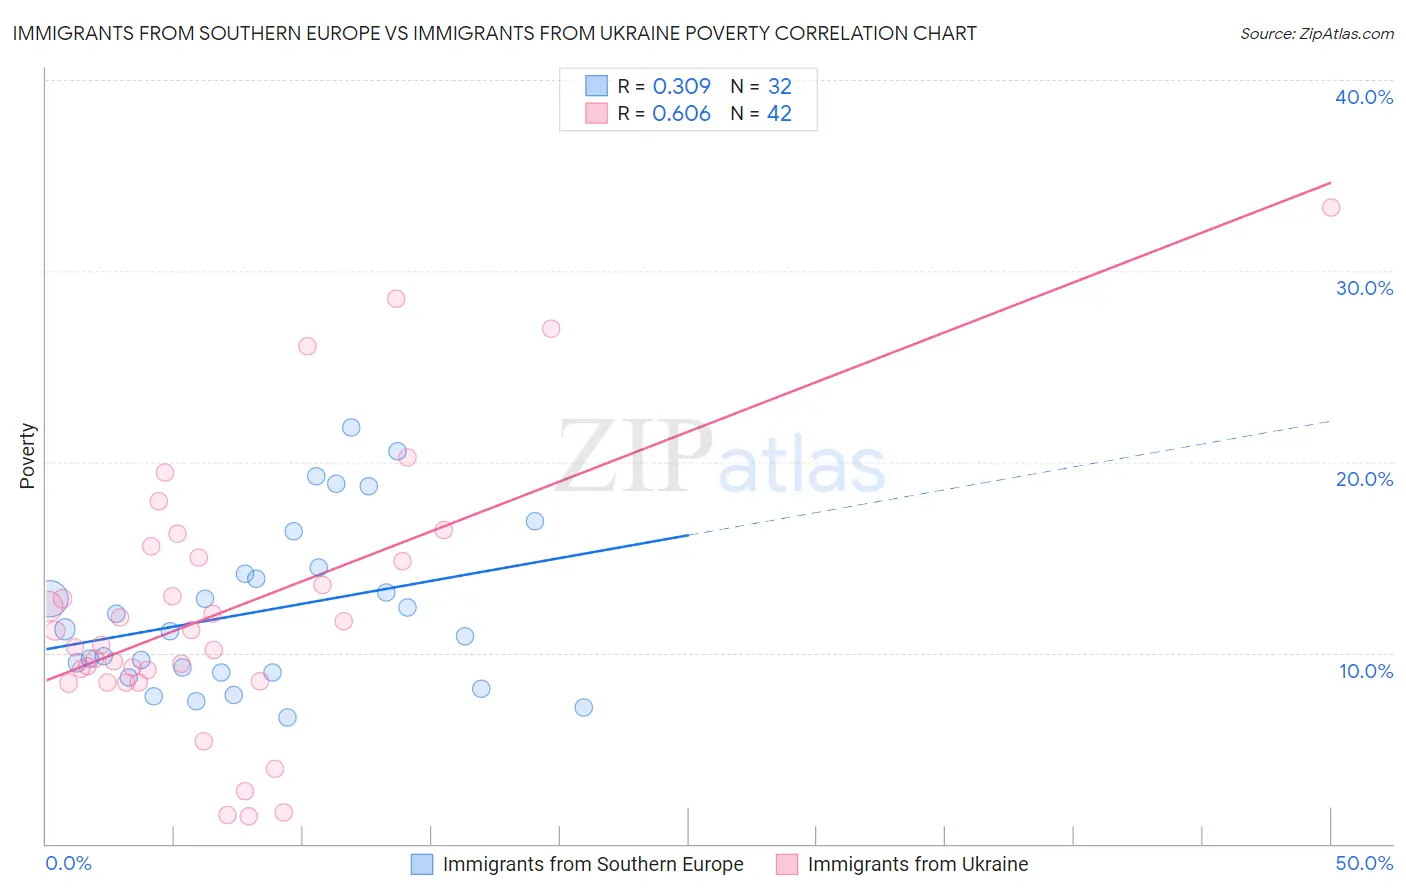
Immigrants from Southern Europe vs Immigrants from Ukraine Poverty Correlation Chart
The statistical analysis conducted on geographies consisting of 402,613,085 people shows a mild positive correlation between the proportion of Immigrants from Southern Europe and poverty level in the United States with a correlation coefficient (R) of 0.309 and weighted average of 11.6%. Similarly, the statistical analysis conducted on geographies consisting of 289,636,773 people shows a significant positive correlation between the proportion of Immigrants from Ukraine and poverty level in the United States with a correlation coefficient (R) of 0.606 and weighted average of 11.8%, a difference of 1.1%.
Poverty Correlation Summary
| Measurement | Immigrants from Southern Europe | Immigrants from Ukraine |
| Minimum | 6.6% | 1.5% |
| Maximum | 21.8% | 33.3% |
| Range | 15.2% | 31.9% |
| Mean | 12.2% | 12.3% |
| Median | 11.2% | 10.8% |
| Interquartile 25% (IQ1) | 9.0% | 8.5% |
| Interquartile 75% (IQ3) | 14.3% | 15.0% |
| Interquartile Range (IQR) | 5.3% | 6.5% |
| Standard Deviation (Sample) | 4.3% | 7.0% |
| Standard Deviation (Population) | 4.2% | 6.9% |
Demographics Similar to Immigrants from Southern Europe and Immigrants from Ukraine by Poverty
In terms of poverty, the demographic groups most similar to Immigrants from Southern Europe are Immigrants from Belarus (11.6%, a difference of 0.0%), Immigrants from China (11.6%, a difference of 0.020%), French Canadian (11.6%, a difference of 0.070%), Albanian (11.7%, a difference of 0.16%), and Immigrants from Russia (11.7%, a difference of 0.33%). Similarly, the demographic groups most similar to Immigrants from Ukraine are South African (11.7%, a difference of 0.090%), French (11.8%, a difference of 0.10%), Immigrants from Israel (11.7%, a difference of 0.19%), Immigrants from Argentina (11.7%, a difference of 0.31%), and Immigrants from Norway (11.7%, a difference of 0.33%).
| Demographics | Rating | Rank | Poverty |
| French Canadians | 91.0 /100 | #111 | Exceptional 11.6% |
| Immigrants | Southern Europe | 90.8 /100 | #112 | Exceptional 11.6% |
| Immigrants | Belarus | 90.8 /100 | #113 | Exceptional 11.6% |
| Immigrants | China | 90.7 /100 | #114 | Exceptional 11.6% |
| Albanians | 90.3 /100 | #115 | Exceptional 11.7% |
| Immigrants | Russia | 89.7 /100 | #116 | Excellent 11.7% |
| Sri Lankans | 89.4 /100 | #117 | Excellent 11.7% |
| Argentineans | 89.1 /100 | #118 | Excellent 11.7% |
| Tlingit-Haida | 89.0 /100 | #119 | Excellent 11.7% |
| Immigrants | South Eastern Asia | 88.9 /100 | #120 | Excellent 11.7% |
| New Zealanders | 88.7 /100 | #121 | Excellent 11.7% |
| Puget Sound Salish | 88.7 /100 | #122 | Excellent 11.7% |
| Immigrants | Hungary | 88.6 /100 | #123 | Excellent 11.7% |
| Soviet Union | 88.4 /100 | #124 | Excellent 11.7% |
| Immigrants | Brazil | 88.2 /100 | #125 | Excellent 11.7% |
| Immigrants | Norway | 88.0 /100 | #126 | Excellent 11.7% |
| Immigrants | Argentina | 88.0 /100 | #127 | Excellent 11.7% |
| Immigrants | Israel | 87.4 /100 | #128 | Excellent 11.7% |
| South Africans | 87.0 /100 | #129 | Excellent 11.7% |
| Immigrants | Ukraine | 86.6 /100 | #130 | Excellent 11.8% |
| French | 86.1 /100 | #131 | Excellent 11.8% |