Immigrants from South Central Asia vs Romanian Poverty
COMPARE
Immigrants from South Central Asia
Romanian
Poverty
Poverty Comparison
Immigrants from South Central Asia
Romanians
10.2%
POVERTY
99.9/ 100
METRIC RATING
9th/ 347
METRIC RANK
11.4%
POVERTY
94.9/ 100
METRIC RATING
93rd/ 347
METRIC RANK
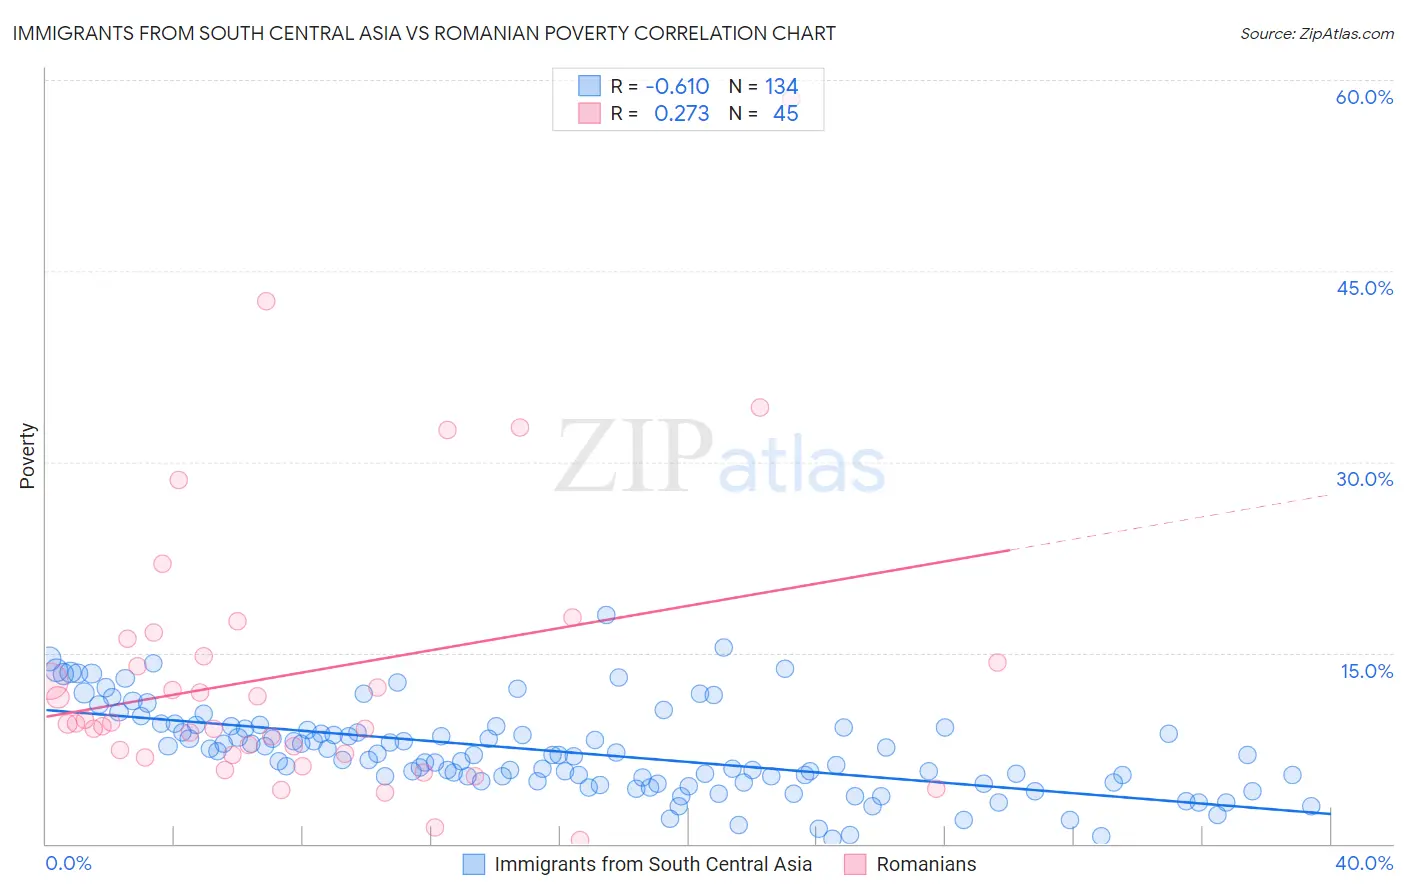
Immigrants from South Central Asia vs Romanian Poverty Correlation Chart
The statistical analysis conducted on geographies consisting of 472,664,539 people shows a significant negative correlation between the proportion of Immigrants from South Central Asia and poverty level in the United States with a correlation coefficient (R) of -0.610 and weighted average of 10.2%. Similarly, the statistical analysis conducted on geographies consisting of 377,713,994 people shows a weak positive correlation between the proportion of Romanians and poverty level in the United States with a correlation coefficient (R) of 0.273 and weighted average of 11.4%, a difference of 12.1%.
Poverty Correlation Summary
| Measurement | Immigrants from South Central Asia | Romanian |
| Minimum | 0.44% | 0.31% |
| Maximum | 18.0% | 58.5% |
| Range | 17.6% | 58.2% |
| Mean | 7.3% | 13.5% |
| Median | 7.0% | 9.4% |
| Interquartile 25% (IQ1) | 4.9% | 7.0% |
| Interquartile 75% (IQ3) | 9.2% | 15.4% |
| Interquartile Range (IQR) | 4.2% | 8.4% |
| Standard Deviation (Sample) | 3.4% | 11.3% |
| Standard Deviation (Population) | 3.4% | 11.2% |
Similar Demographics by Poverty
Demographics Similar to Immigrants from South Central Asia by Poverty
In terms of poverty, the demographic groups most similar to Immigrants from South Central Asia are Bulgarian (10.2%, a difference of 0.41%), Maltese (10.2%, a difference of 0.45%), Filipino (10.1%, a difference of 0.87%), Assyrian/Chaldean/Syriac (10.1%, a difference of 1.0%), and Immigrants from Ireland (10.1%, a difference of 1.2%).
| Demographics | Rating | Rank | Poverty |
| Chinese | 100.0 /100 | #2 | Exceptional 9.5% |
| Thais | 100.0 /100 | #3 | Exceptional 9.6% |
| Immigrants | Taiwan | 100.0 /100 | #4 | Exceptional 9.7% |
| Immigrants | Ireland | 99.9 /100 | #5 | Exceptional 10.1% |
| Assyrians/Chaldeans/Syriacs | 99.9 /100 | #6 | Exceptional 10.1% |
| Filipinos | 99.9 /100 | #7 | Exceptional 10.1% |
| Maltese | 99.9 /100 | #8 | Exceptional 10.2% |
| Immigrants | South Central Asia | 99.9 /100 | #9 | Exceptional 10.2% |
| Bulgarians | 99.9 /100 | #10 | Exceptional 10.2% |
| Immigrants | Lithuania | 99.9 /100 | #11 | Exceptional 10.3% |
| Bhutanese | 99.8 /100 | #12 | Exceptional 10.4% |
| Immigrants | Hong Kong | 99.8 /100 | #13 | Exceptional 10.4% |
| Immigrants | Bolivia | 99.8 /100 | #14 | Exceptional 10.4% |
| Bolivians | 99.8 /100 | #15 | Exceptional 10.4% |
| Lithuanians | 99.8 /100 | #16 | Exceptional 10.5% |
Demographics Similar to Romanians by Poverty
In terms of poverty, the demographic groups most similar to Romanians are Paraguayan (11.4%, a difference of 0.020%), Australian (11.4%, a difference of 0.020%), British (11.4%, a difference of 0.030%), Immigrants from South Africa (11.5%, a difference of 0.14%), and Finnish (11.4%, a difference of 0.17%).
| Demographics | Rating | Rank | Poverty |
| Jordanians | 96.0 /100 | #86 | Exceptional 11.4% |
| Northern Europeans | 96.0 /100 | #87 | Exceptional 11.4% |
| Belgians | 95.8 /100 | #88 | Exceptional 11.4% |
| Czechoslovakians | 95.7 /100 | #89 | Exceptional 11.4% |
| Immigrants | Denmark | 95.5 /100 | #90 | Exceptional 11.4% |
| Finns | 95.2 /100 | #91 | Exceptional 11.4% |
| British | 95.0 /100 | #92 | Exceptional 11.4% |
| Romanians | 94.9 /100 | #93 | Exceptional 11.4% |
| Paraguayans | 94.9 /100 | #94 | Exceptional 11.4% |
| Australians | 94.9 /100 | #95 | Exceptional 11.4% |
| Immigrants | South Africa | 94.7 /100 | #96 | Exceptional 11.5% |
| Immigrants | Egypt | 94.6 /100 | #97 | Exceptional 11.5% |
| Immigrants | Latvia | 94.5 /100 | #98 | Exceptional 11.5% |
| Immigrants | Indonesia | 94.2 /100 | #99 | Exceptional 11.5% |
| Scottish | 94.0 /100 | #100 | Exceptional 11.5% |