Immigrants from South Central Asia vs Immigrants from Belize Poverty
COMPARE
Immigrants from South Central Asia
Immigrants from Belize
Poverty
Poverty Comparison
Immigrants from South Central Asia
Immigrants from Belize
10.2%
POVERTY
99.9/ 100
METRIC RATING
9th/ 347
METRIC RANK
15.1%
POVERTY
0.0/ 100
METRIC RATING
289th/ 347
METRIC RANK
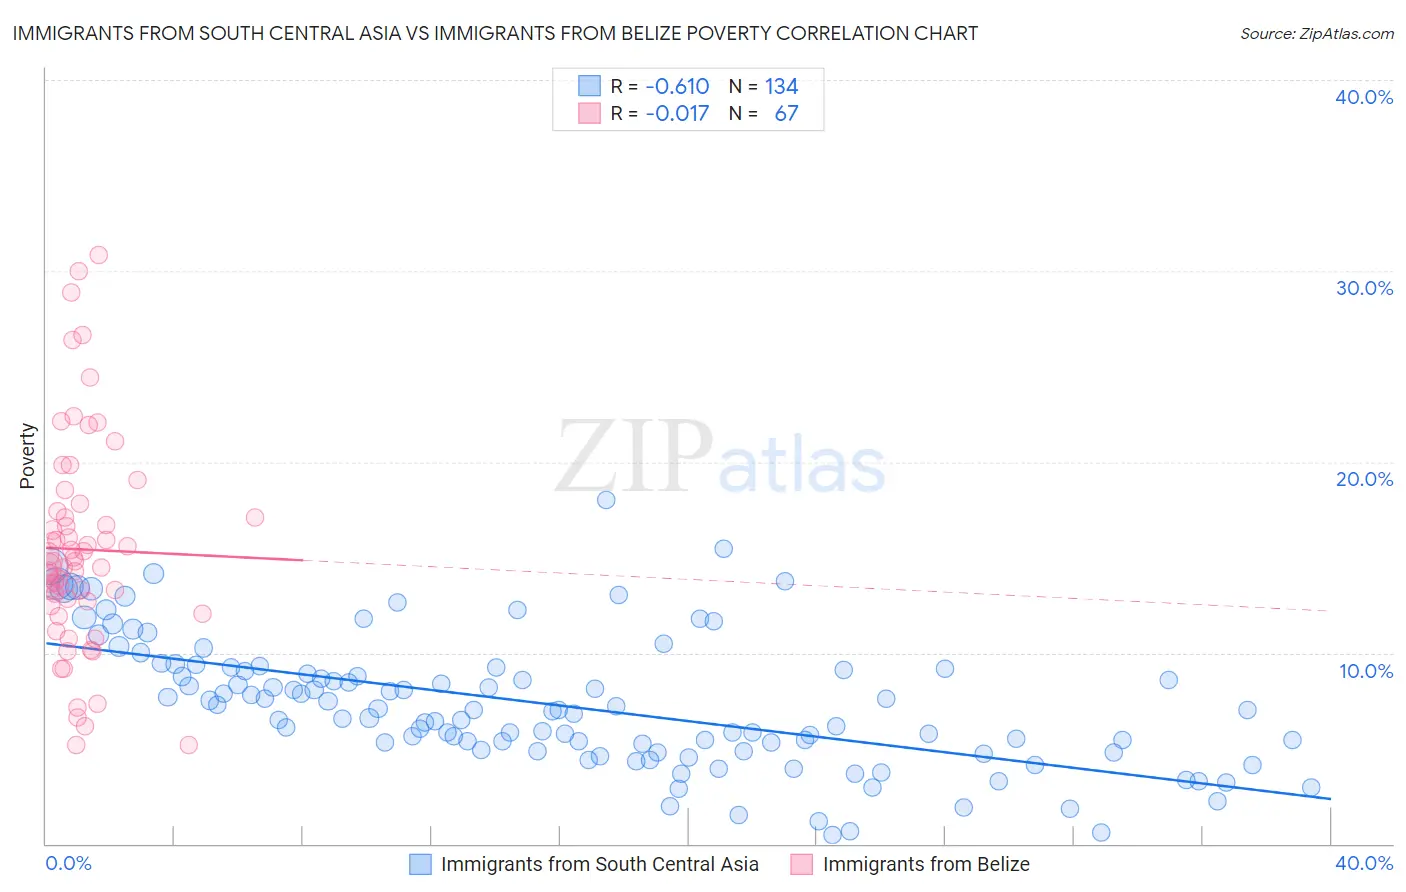
Immigrants from South Central Asia vs Immigrants from Belize Poverty Correlation Chart
The statistical analysis conducted on geographies consisting of 472,664,539 people shows a significant negative correlation between the proportion of Immigrants from South Central Asia and poverty level in the United States with a correlation coefficient (R) of -0.610 and weighted average of 10.2%. Similarly, the statistical analysis conducted on geographies consisting of 130,298,091 people shows no correlation between the proportion of Immigrants from Belize and poverty level in the United States with a correlation coefficient (R) of -0.017 and weighted average of 15.1%, a difference of 47.8%.
Poverty Correlation Summary
| Measurement | Immigrants from South Central Asia | Immigrants from Belize |
| Minimum | 0.44% | 5.2% |
| Maximum | 18.0% | 30.8% |
| Range | 17.6% | 25.7% |
| Mean | 7.3% | 15.4% |
| Median | 7.0% | 14.8% |
| Interquartile 25% (IQ1) | 4.9% | 12.5% |
| Interquartile 75% (IQ3) | 9.2% | 17.4% |
| Interquartile Range (IQR) | 4.2% | 5.0% |
| Standard Deviation (Sample) | 3.4% | 5.6% |
| Standard Deviation (Population) | 3.4% | 5.6% |
Similar Demographics by Poverty
Demographics Similar to Immigrants from South Central Asia by Poverty
In terms of poverty, the demographic groups most similar to Immigrants from South Central Asia are Bulgarian (10.2%, a difference of 0.41%), Maltese (10.2%, a difference of 0.45%), Filipino (10.1%, a difference of 0.87%), Assyrian/Chaldean/Syriac (10.1%, a difference of 1.0%), and Immigrants from Ireland (10.1%, a difference of 1.2%).
| Demographics | Rating | Rank | Poverty |
| Chinese | 100.0 /100 | #2 | Exceptional 9.5% |
| Thais | 100.0 /100 | #3 | Exceptional 9.6% |
| Immigrants | Taiwan | 100.0 /100 | #4 | Exceptional 9.7% |
| Immigrants | Ireland | 99.9 /100 | #5 | Exceptional 10.1% |
| Assyrians/Chaldeans/Syriacs | 99.9 /100 | #6 | Exceptional 10.1% |
| Filipinos | 99.9 /100 | #7 | Exceptional 10.1% |
| Maltese | 99.9 /100 | #8 | Exceptional 10.2% |
| Immigrants | South Central Asia | 99.9 /100 | #9 | Exceptional 10.2% |
| Bulgarians | 99.9 /100 | #10 | Exceptional 10.2% |
| Immigrants | Lithuania | 99.9 /100 | #11 | Exceptional 10.3% |
| Bhutanese | 99.8 /100 | #12 | Exceptional 10.4% |
| Immigrants | Hong Kong | 99.8 /100 | #13 | Exceptional 10.4% |
| Immigrants | Bolivia | 99.8 /100 | #14 | Exceptional 10.4% |
| Bolivians | 99.8 /100 | #15 | Exceptional 10.4% |
| Lithuanians | 99.8 /100 | #16 | Exceptional 10.5% |
Demographics Similar to Immigrants from Belize by Poverty
In terms of poverty, the demographic groups most similar to Immigrants from Belize are Mexican (15.1%, a difference of 0.10%), Yaqui (15.1%, a difference of 0.12%), Inupiat (15.1%, a difference of 0.13%), Immigrants from Cabo Verde (15.1%, a difference of 0.23%), and Indonesian (15.1%, a difference of 0.28%).
| Demographics | Rating | Rank | Poverty |
| Comanche | 0.0 /100 | #282 | Tragic 15.0% |
| Immigrants | Haiti | 0.0 /100 | #283 | Tragic 15.0% |
| West Indians | 0.0 /100 | #284 | Tragic 15.0% |
| Vietnamese | 0.0 /100 | #285 | Tragic 15.0% |
| Immigrants | Latin America | 0.0 /100 | #286 | Tragic 15.0% |
| Inupiat | 0.0 /100 | #287 | Tragic 15.1% |
| Yaqui | 0.0 /100 | #288 | Tragic 15.1% |
| Immigrants | Belize | 0.0 /100 | #289 | Tragic 15.1% |
| Mexicans | 0.0 /100 | #290 | Tragic 15.1% |
| Immigrants | Cabo Verde | 0.0 /100 | #291 | Tragic 15.1% |
| Indonesians | 0.0 /100 | #292 | Tragic 15.1% |
| Immigrants | Zaire | 0.0 /100 | #293 | Tragic 15.1% |
| Blackfeet | 0.0 /100 | #294 | Tragic 15.2% |
| Guatemalans | 0.0 /100 | #295 | Tragic 15.3% |
| Hispanics or Latinos | 0.0 /100 | #296 | Tragic 15.3% |