Immigrants from South America vs Yuman Male Disability
COMPARE
Immigrants from South America
Yuman
Male Disability
Male Disability Comparison
Immigrants from South America
Yuman
10.4%
MALE DISABILITY
99.6/ 100
METRIC RATING
57th/ 347
METRIC RANK
14.7%
MALE DISABILITY
0.0/ 100
METRIC RATING
333rd/ 347
METRIC RANK
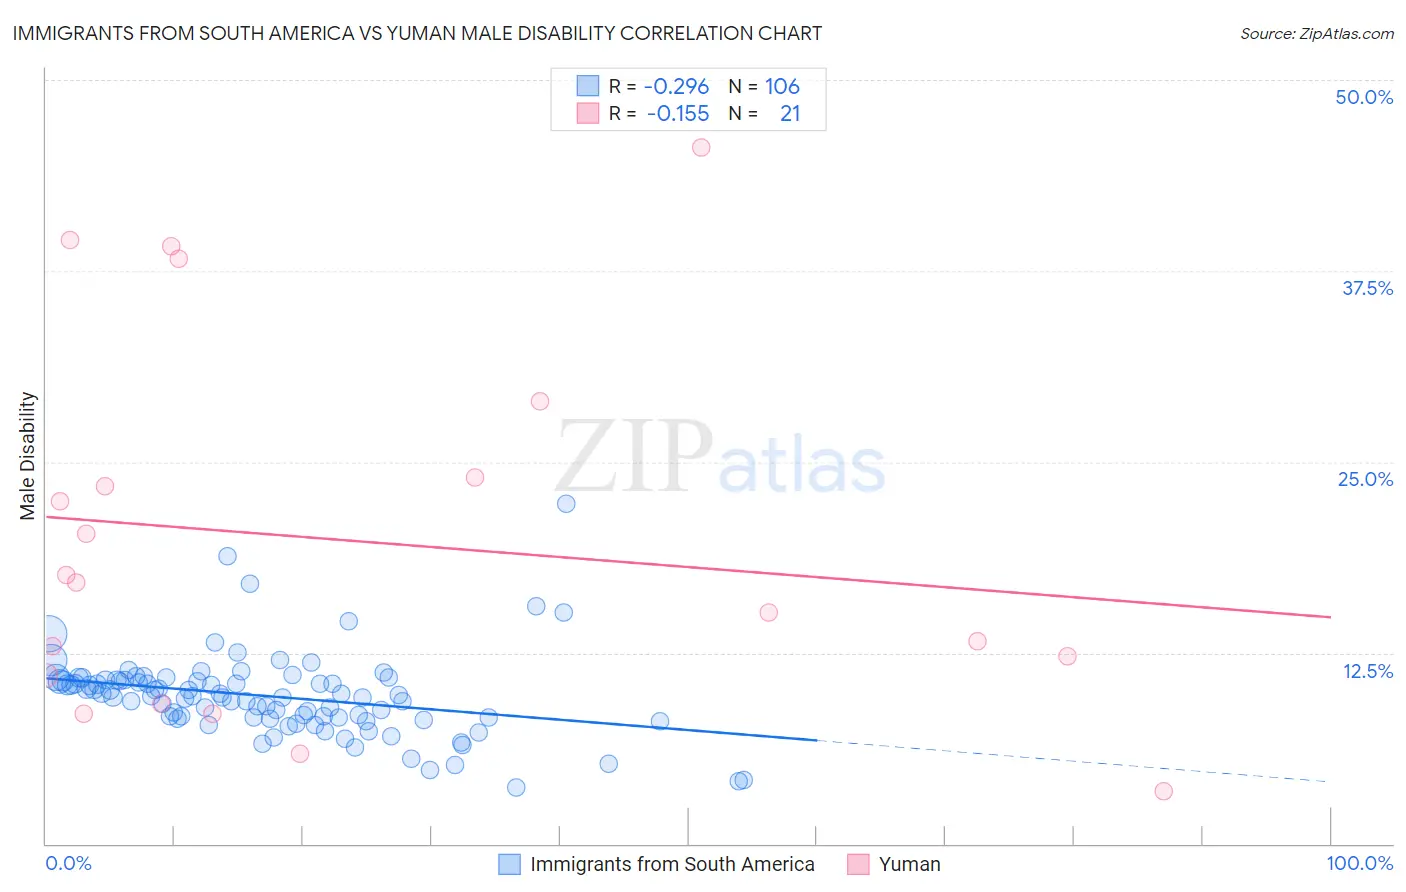
Immigrants from South America vs Yuman Male Disability Correlation Chart
The statistical analysis conducted on geographies consisting of 486,285,750 people shows a weak negative correlation between the proportion of Immigrants from South America and percentage of males with a disability in the United States with a correlation coefficient (R) of -0.296 and weighted average of 10.4%. Similarly, the statistical analysis conducted on geographies consisting of 40,663,251 people shows a poor negative correlation between the proportion of Yuman and percentage of males with a disability in the United States with a correlation coefficient (R) of -0.155 and weighted average of 14.7%, a difference of 42.0%.
Male Disability Correlation Summary
| Measurement | Immigrants from South America | Yuman |
| Minimum | 3.7% | 3.4% |
| Maximum | 22.2% | 45.6% |
| Range | 18.6% | 42.1% |
| Mean | 9.7% | 19.8% |
| Median | 9.7% | 17.1% |
| Interquartile 25% (IQ1) | 8.3% | 10.1% |
| Interquartile 75% (IQ3) | 10.7% | 26.5% |
| Interquartile Range (IQR) | 2.5% | 16.4% |
| Standard Deviation (Sample) | 2.7% | 12.2% |
| Standard Deviation (Population) | 2.7% | 11.9% |
Similar Demographics by Male Disability
Demographics Similar to Immigrants from South America by Male Disability
In terms of male disability, the demographic groups most similar to Immigrants from South America are Tongan (10.4%, a difference of 0.020%), Immigrants from Eritrea (10.4%, a difference of 0.060%), Immigrants from Japan (10.4%, a difference of 0.070%), Peruvian (10.4%, a difference of 0.080%), and Immigrants from Uzbekistan (10.4%, a difference of 0.12%).
| Demographics | Rating | Rank | Male Disability |
| South Americans | 99.6 /100 | #50 | Exceptional 10.3% |
| Salvadorans | 99.6 /100 | #51 | Exceptional 10.4% |
| Immigrants | Saudi Arabia | 99.6 /100 | #52 | Exceptional 10.4% |
| Immigrants | Uzbekistan | 99.6 /100 | #53 | Exceptional 10.4% |
| Peruvians | 99.6 /100 | #54 | Exceptional 10.4% |
| Immigrants | Eritrea | 99.6 /100 | #55 | Exceptional 10.4% |
| Tongans | 99.6 /100 | #56 | Exceptional 10.4% |
| Immigrants | South America | 99.6 /100 | #57 | Exceptional 10.4% |
| Immigrants | Japan | 99.5 /100 | #58 | Exceptional 10.4% |
| Immigrants | Australia | 99.5 /100 | #59 | Exceptional 10.4% |
| Immigrants | Colombia | 99.5 /100 | #60 | Exceptional 10.4% |
| Immigrants | Northern Africa | 99.4 /100 | #61 | Exceptional 10.4% |
| Immigrants | Ecuador | 99.3 /100 | #62 | Exceptional 10.4% |
| Immigrants | Belarus | 99.3 /100 | #63 | Exceptional 10.4% |
| Jordanians | 99.3 /100 | #64 | Exceptional 10.5% |
Demographics Similar to Yuman by Male Disability
In terms of male disability, the demographic groups most similar to Yuman are Seminole (14.7%, a difference of 0.10%), Cherokee (14.8%, a difference of 0.68%), Dutch West Indian (14.8%, a difference of 0.70%), Tohono O'odham (14.6%, a difference of 0.87%), and Alaskan Athabascan (14.9%, a difference of 1.2%).
| Demographics | Rating | Rank | Male Disability |
| Natives/Alaskans | 0.0 /100 | #326 | Tragic 14.2% |
| Potawatomi | 0.0 /100 | #327 | Tragic 14.2% |
| Chippewa | 0.0 /100 | #328 | Tragic 14.3% |
| Cajuns | 0.0 /100 | #329 | Tragic 14.4% |
| Navajo | 0.0 /100 | #330 | Tragic 14.4% |
| Tohono O'odham | 0.0 /100 | #331 | Tragic 14.6% |
| Seminole | 0.0 /100 | #332 | Tragic 14.7% |
| Yuman | 0.0 /100 | #333 | Tragic 14.7% |
| Cherokee | 0.0 /100 | #334 | Tragic 14.8% |
| Dutch West Indians | 0.0 /100 | #335 | Tragic 14.8% |
| Alaskan Athabascans | 0.0 /100 | #336 | Tragic 14.9% |
| Menominee | 0.0 /100 | #337 | Tragic 15.0% |
| Pueblo | 0.0 /100 | #338 | Tragic 15.0% |
| Chickasaw | 0.0 /100 | #339 | Tragic 15.1% |
| Lumbee | 0.0 /100 | #340 | Tragic 15.2% |