Immigrants from South Africa vs Bangladeshi Male Unemployment
COMPARE
Immigrants from South Africa
Bangladeshi
Male Unemployment
Male Unemployment Comparison
Immigrants from South Africa
Bangladeshis
5.0%
MALE UNEMPLOYMENT
97.1/ 100
METRIC RATING
72nd/ 347
METRIC RANK
5.7%
MALE UNEMPLOYMENT
0.8/ 100
METRIC RATING
243rd/ 347
METRIC RANK
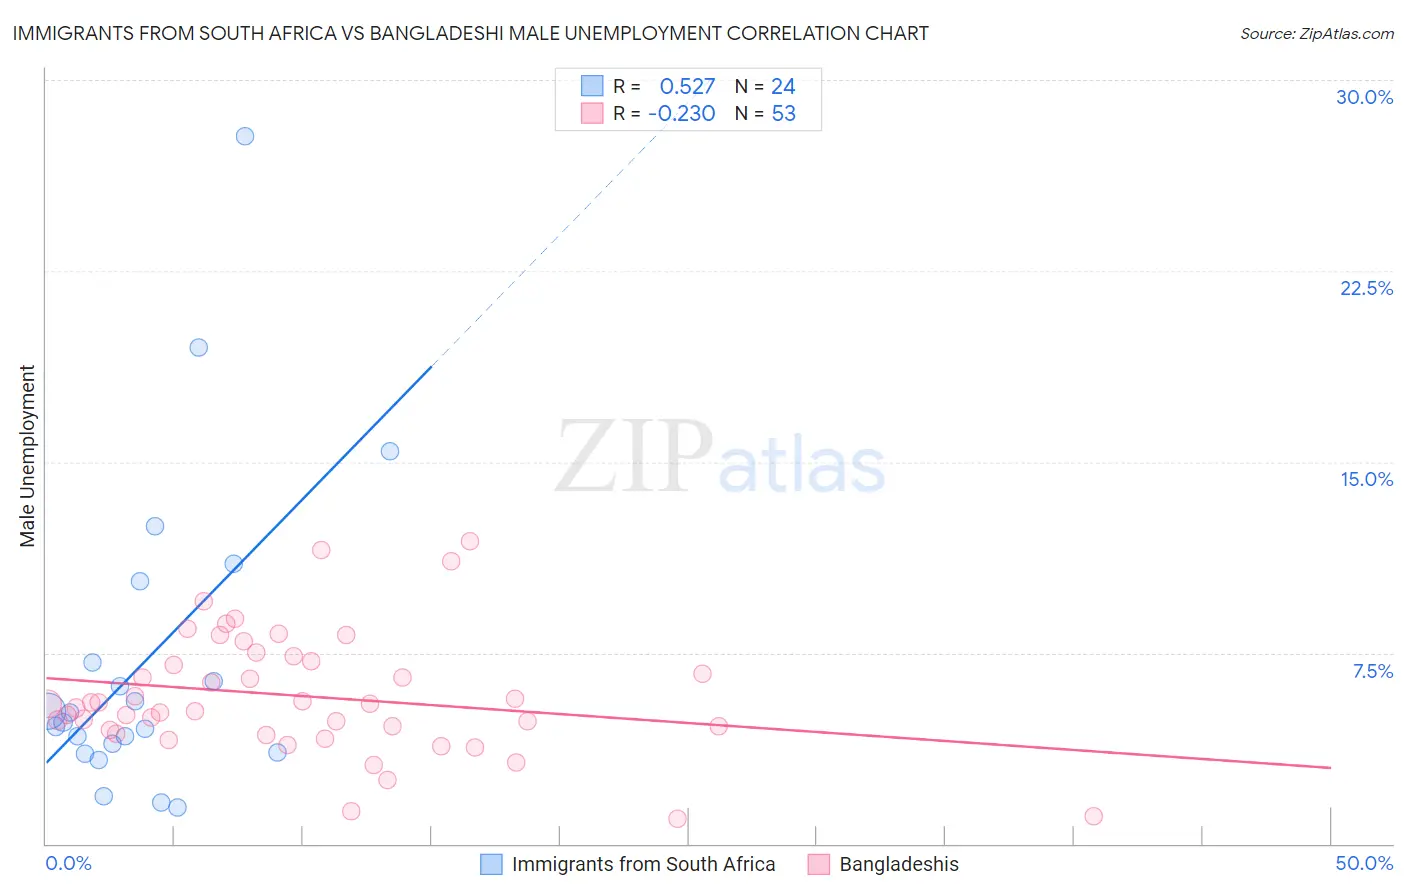
Immigrants from South Africa vs Bangladeshi Male Unemployment Correlation Chart
The statistical analysis conducted on geographies consisting of 232,631,377 people shows a substantial positive correlation between the proportion of Immigrants from South Africa and unemployment rate among males in the United States with a correlation coefficient (R) of 0.527 and weighted average of 5.0%. Similarly, the statistical analysis conducted on geographies consisting of 141,111,800 people shows a weak negative correlation between the proportion of Bangladeshis and unemployment rate among males in the United States with a correlation coefficient (R) of -0.230 and weighted average of 5.7%, a difference of 12.9%.
Male Unemployment Correlation Summary
| Measurement | Immigrants from South Africa | Bangladeshi |
| Minimum | 1.4% | 1.0% |
| Maximum | 27.8% | 11.9% |
| Range | 26.4% | 10.9% |
| Mean | 7.2% | 5.8% |
| Median | 5.0% | 5.5% |
| Interquartile 25% (IQ1) | 3.8% | 4.4% |
| Interquartile 75% (IQ3) | 8.7% | 7.3% |
| Interquartile Range (IQR) | 5.0% | 2.9% |
| Standard Deviation (Sample) | 6.2% | 2.4% |
| Standard Deviation (Population) | 6.1% | 2.4% |
Similar Demographics by Male Unemployment
Demographics Similar to Immigrants from South Africa by Male Unemployment
In terms of male unemployment, the demographic groups most similar to Immigrants from South Africa are New Zealander (5.0%, a difference of 0.070%), Greek (5.0%, a difference of 0.080%), White/Caucasian (5.0%, a difference of 0.090%), Immigrants from North America (5.0%, a difference of 0.11%), and Assyrian/Chaldean/Syriac (5.0%, a difference of 0.14%).
| Demographics | Rating | Rank | Male Unemployment |
| Icelanders | 97.6 /100 | #65 | Exceptional 5.0% |
| Finns | 97.5 /100 | #66 | Exceptional 5.0% |
| Immigrants | Canada | 97.5 /100 | #67 | Exceptional 5.0% |
| Australians | 97.4 /100 | #68 | Exceptional 5.0% |
| Immigrants | Sweden | 97.4 /100 | #69 | Exceptional 5.0% |
| Whites/Caucasians | 97.3 /100 | #70 | Exceptional 5.0% |
| New Zealanders | 97.3 /100 | #71 | Exceptional 5.0% |
| Immigrants | South Africa | 97.1 /100 | #72 | Exceptional 5.0% |
| Greeks | 97.0 /100 | #73 | Exceptional 5.0% |
| Immigrants | North America | 96.9 /100 | #74 | Exceptional 5.0% |
| Assyrians/Chaldeans/Syriacs | 96.9 /100 | #75 | Exceptional 5.0% |
| Immigrants | Sudan | 96.5 /100 | #76 | Exceptional 5.0% |
| Iranians | 96.4 /100 | #77 | Exceptional 5.0% |
| Immigrants | Northern Europe | 96.4 /100 | #78 | Exceptional 5.0% |
| South Africans | 96.4 /100 | #79 | Exceptional 5.0% |
Demographics Similar to Bangladeshis by Male Unemployment
In terms of male unemployment, the demographic groups most similar to Bangladeshis are Immigrants from El Salvador (5.7%, a difference of 0.050%), Yaqui (5.7%, a difference of 0.21%), Ottawa (5.7%, a difference of 0.28%), Iroquois (5.7%, a difference of 0.30%), and Salvadoran (5.7%, a difference of 0.35%).
| Demographics | Rating | Rank | Male Unemployment |
| Guatemalans | 1.2 /100 | #236 | Tragic 5.6% |
| Hondurans | 1.1 /100 | #237 | Tragic 5.6% |
| Native Hawaiians | 1.1 /100 | #238 | Tragic 5.6% |
| Immigrants | Guatemala | 1.1 /100 | #239 | Tragic 5.6% |
| Immigrants | Cameroon | 1.0 /100 | #240 | Tragic 5.6% |
| Salvadorans | 1.0 /100 | #241 | Tragic 5.7% |
| Ottawa | 0.9 /100 | #242 | Tragic 5.7% |
| Bangladeshis | 0.8 /100 | #243 | Tragic 5.7% |
| Immigrants | El Salvador | 0.7 /100 | #244 | Tragic 5.7% |
| Yaqui | 0.7 /100 | #245 | Tragic 5.7% |
| Iroquois | 0.6 /100 | #246 | Tragic 5.7% |
| Hawaiians | 0.6 /100 | #247 | Tragic 5.7% |
| Marshallese | 0.5 /100 | #248 | Tragic 5.7% |
| Cree | 0.4 /100 | #249 | Tragic 5.7% |
| Immigrants | Bahamas | 0.4 /100 | #250 | Tragic 5.7% |