Immigrants from South Africa vs Bangladeshi 6th Grade
COMPARE
Immigrants from South Africa
Bangladeshi
6th Grade
6th Grade Comparison
Immigrants from South Africa
Bangladeshis
97.5%
6TH GRADE
98.9/ 100
METRIC RATING
88th/ 347
METRIC RANK
95.7%
6TH GRADE
0.0/ 100
METRIC RATING
303rd/ 347
METRIC RANK
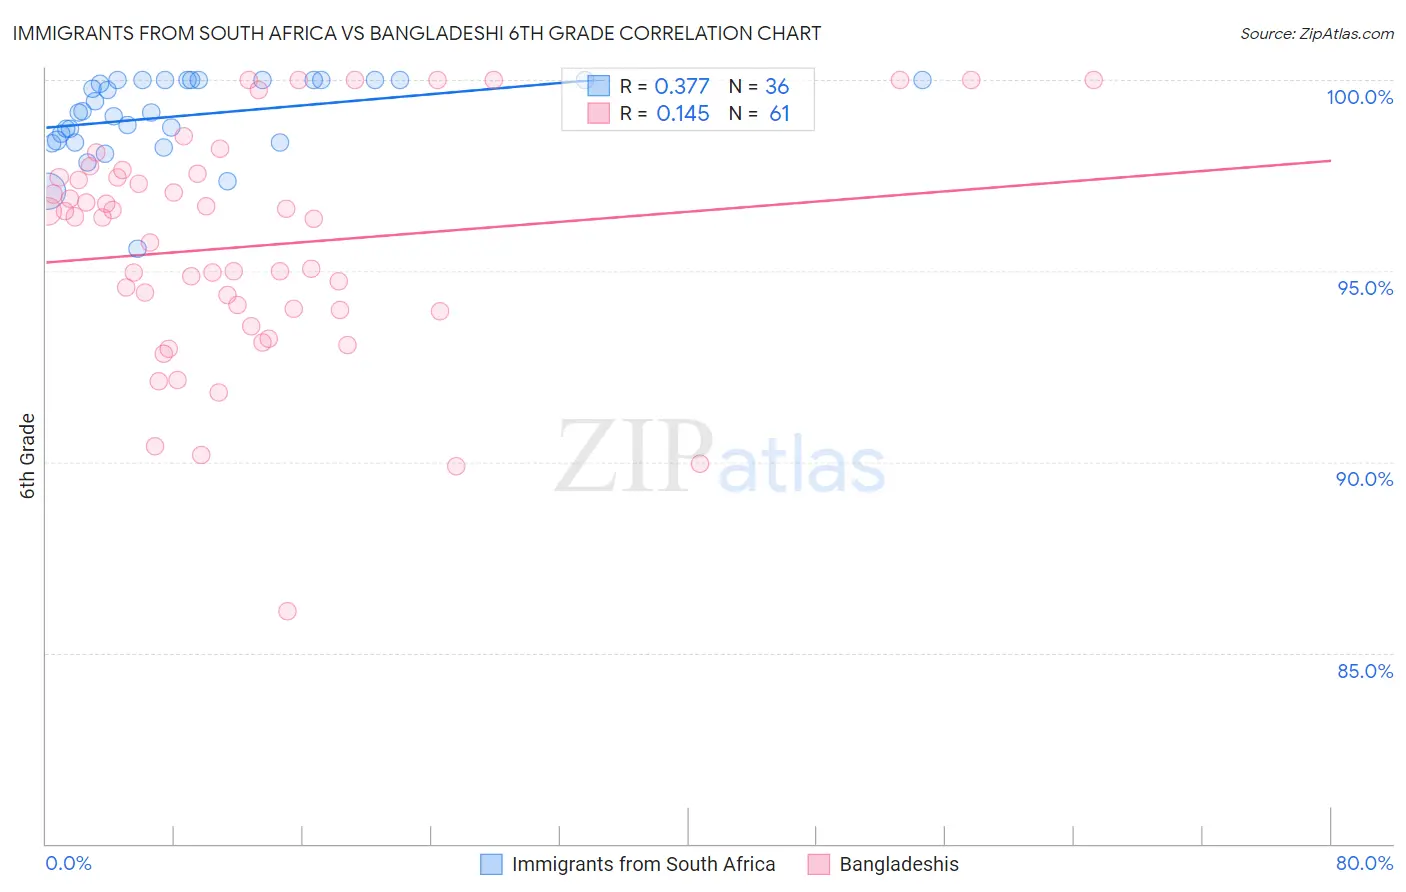
Immigrants from South Africa vs Bangladeshi 6th Grade Correlation Chart
The statistical analysis conducted on geographies consisting of 233,321,693 people shows a mild positive correlation between the proportion of Immigrants from South Africa and percentage of population with at least 6th grade education in the United States with a correlation coefficient (R) of 0.377 and weighted average of 97.5%. Similarly, the statistical analysis conducted on geographies consisting of 141,430,495 people shows a poor positive correlation between the proportion of Bangladeshis and percentage of population with at least 6th grade education in the United States with a correlation coefficient (R) of 0.145 and weighted average of 95.7%, a difference of 2.0%.
6th Grade Correlation Summary
| Measurement | Immigrants from South Africa | Bangladeshi |
| Minimum | 95.6% | 86.1% |
| Maximum | 100.0% | 100.0% |
| Range | 4.4% | 13.9% |
| Mean | 99.1% | 95.7% |
| Median | 99.2% | 96.4% |
| Interquartile 25% (IQ1) | 98.4% | 94.0% |
| Interquartile 75% (IQ3) | 100.0% | 97.5% |
| Interquartile Range (IQR) | 1.6% | 3.5% |
| Standard Deviation (Sample) | 1.0% | 3.0% |
| Standard Deviation (Population) | 1.0% | 3.0% |
Similar Demographics by 6th Grade
Demographics Similar to Immigrants from South Africa by 6th Grade
In terms of 6th grade, the demographic groups most similar to Immigrants from South Africa are Immigrants from Belgium (97.5%, a difference of 0.0%), Puget Sound Salish (97.5%, a difference of 0.0%), Immigrants from Australia (97.5%, a difference of 0.0%), Delaware (97.6%, a difference of 0.010%), and Pueblo (97.5%, a difference of 0.010%).
| Demographics | Rating | Rank | 6th Grade |
| Lumbee | 99.2 /100 | #81 | Exceptional 97.6% |
| Zimbabweans | 99.1 /100 | #82 | Exceptional 97.6% |
| Potawatomi | 99.1 /100 | #83 | Exceptional 97.6% |
| Shoshone | 99.0 /100 | #84 | Exceptional 97.6% |
| Delaware | 98.9 /100 | #85 | Exceptional 97.6% |
| Immigrants | Belgium | 98.9 /100 | #86 | Exceptional 97.5% |
| Puget Sound Salish | 98.9 /100 | #87 | Exceptional 97.5% |
| Immigrants | South Africa | 98.9 /100 | #88 | Exceptional 97.5% |
| Immigrants | Australia | 98.8 /100 | #89 | Exceptional 97.5% |
| Pueblo | 98.8 /100 | #90 | Exceptional 97.5% |
| Immigrants | Western Europe | 98.8 /100 | #91 | Exceptional 97.5% |
| Romanians | 98.7 /100 | #92 | Exceptional 97.5% |
| Cree | 98.7 /100 | #93 | Exceptional 97.5% |
| Cypriots | 98.7 /100 | #94 | Exceptional 97.5% |
| Immigrants | Ireland | 98.7 /100 | #95 | Exceptional 97.5% |
Demographics Similar to Bangladeshis by 6th Grade
In terms of 6th grade, the demographic groups most similar to Bangladeshis are Indonesian (95.6%, a difference of 0.010%), Immigrants from Cuba (95.6%, a difference of 0.030%), Immigrants from Burma/Myanmar (95.7%, a difference of 0.070%), Immigrants from Haiti (95.6%, a difference of 0.070%), and Immigrants (95.7%, a difference of 0.080%).
| Demographics | Rating | Rank | 6th Grade |
| Immigrants | South Eastern Asia | 0.0 /100 | #296 | Tragic 95.9% |
| Haitians | 0.0 /100 | #297 | Tragic 95.8% |
| Sri Lankans | 0.0 /100 | #298 | Tragic 95.8% |
| Immigrants | Laos | 0.0 /100 | #299 | Tragic 95.7% |
| Immigrants | Dominica | 0.0 /100 | #300 | Tragic 95.7% |
| Immigrants | Immigrants | 0.0 /100 | #301 | Tragic 95.7% |
| Immigrants | Burma/Myanmar | 0.0 /100 | #302 | Tragic 95.7% |
| Bangladeshis | 0.0 /100 | #303 | Tragic 95.7% |
| Indonesians | 0.0 /100 | #304 | Tragic 95.6% |
| Immigrants | Cuba | 0.0 /100 | #305 | Tragic 95.6% |
| Immigrants | Haiti | 0.0 /100 | #306 | Tragic 95.6% |
| Guyanese | 0.0 /100 | #307 | Tragic 95.6% |
| Immigrants | Caribbean | 0.0 /100 | #308 | Tragic 95.6% |
| Puerto Ricans | 0.0 /100 | #309 | Tragic 95.5% |
| Ecuadorians | 0.0 /100 | #310 | Tragic 95.5% |