Immigrants from Sierra Leone vs Luxembourger Poverty
COMPARE
Immigrants from Sierra Leone
Luxembourger
Poverty
Poverty Comparison
Immigrants from Sierra Leone
Luxembourgers
12.5%
POVERTY
36.3/ 100
METRIC RATING
186th/ 347
METRIC RANK
10.6%
POVERTY
99.7/ 100
METRIC RATING
21st/ 347
METRIC RANK
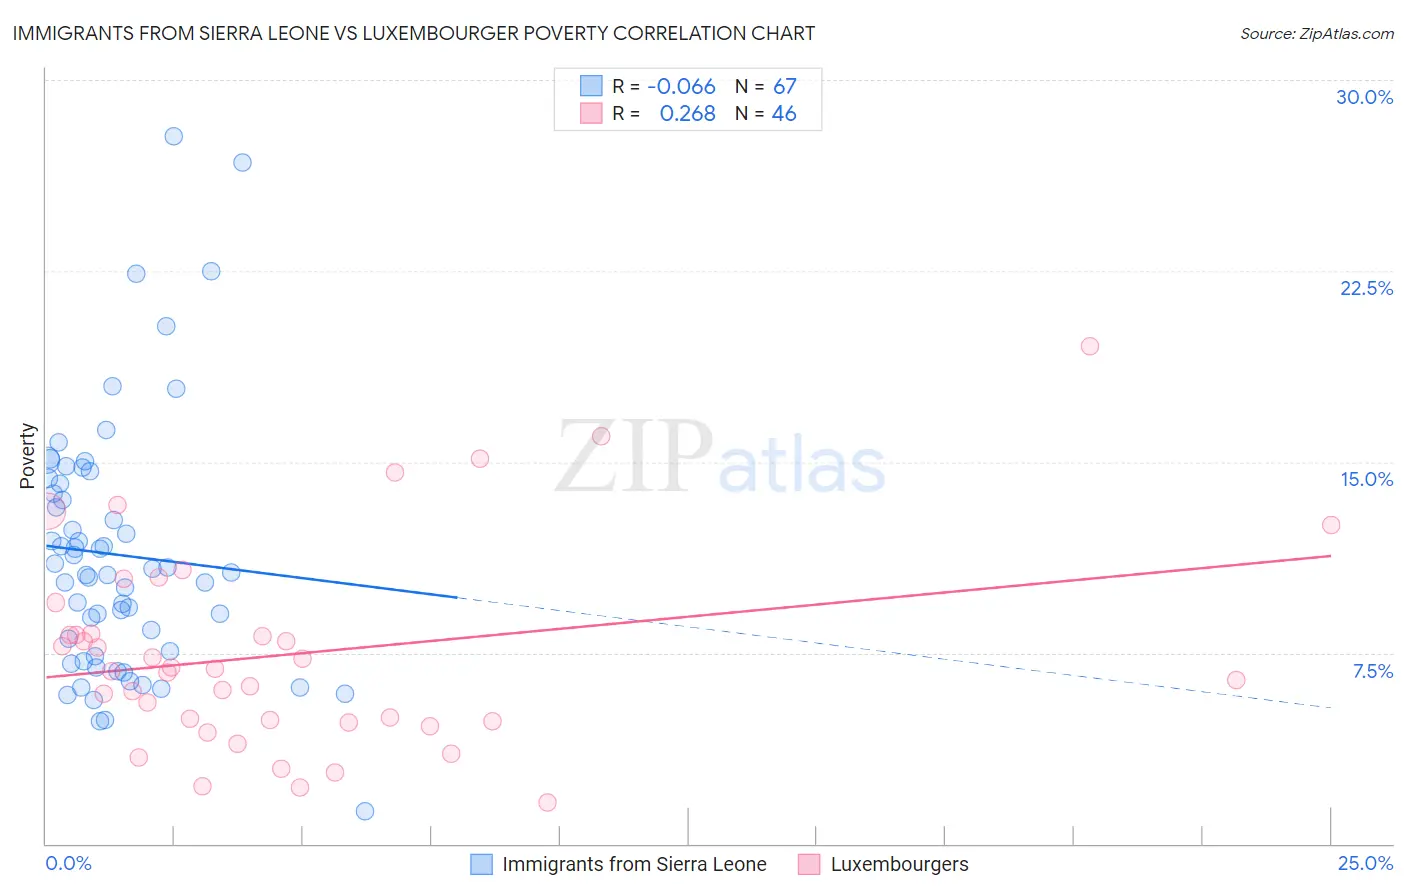
Immigrants from Sierra Leone vs Luxembourger Poverty Correlation Chart
The statistical analysis conducted on geographies consisting of 101,642,850 people shows a slight negative correlation between the proportion of Immigrants from Sierra Leone and poverty level in the United States with a correlation coefficient (R) of -0.066 and weighted average of 12.5%. Similarly, the statistical analysis conducted on geographies consisting of 144,648,044 people shows a weak positive correlation between the proportion of Luxembourgers and poverty level in the United States with a correlation coefficient (R) of 0.268 and weighted average of 10.6%, a difference of 18.0%.
Poverty Correlation Summary
| Measurement | Immigrants from Sierra Leone | Luxembourger |
| Minimum | 1.3% | 1.6% |
| Maximum | 27.8% | 19.5% |
| Range | 26.5% | 17.9% |
| Mean | 11.3% | 7.5% |
| Median | 10.6% | 6.8% |
| Interquartile 25% (IQ1) | 7.4% | 4.8% |
| Interquartile 75% (IQ3) | 14.2% | 8.3% |
| Interquartile Range (IQR) | 6.8% | 3.5% |
| Standard Deviation (Sample) | 5.0% | 3.9% |
| Standard Deviation (Population) | 5.0% | 3.9% |
Similar Demographics by Poverty
Demographics Similar to Immigrants from Sierra Leone by Poverty
In terms of poverty, the demographic groups most similar to Immigrants from Sierra Leone are Israeli (12.5%, a difference of 0.020%), Hawaiian (12.5%, a difference of 0.23%), Kenyan (12.5%, a difference of 0.26%), Immigrants from Costa Rica (12.5%, a difference of 0.32%), and Aleut (12.5%, a difference of 0.32%).
| Demographics | Rating | Rank | Poverty |
| Immigrants | Morocco | 44.0 /100 | #179 | Average 12.4% |
| Mongolians | 43.6 /100 | #180 | Average 12.4% |
| Immigrants | Afghanistan | 42.1 /100 | #181 | Average 12.4% |
| Immigrants | Cameroon | 41.7 /100 | #182 | Average 12.4% |
| Immigrants | Iraq | 40.2 /100 | #183 | Average 12.4% |
| Kenyans | 38.8 /100 | #184 | Fair 12.5% |
| Israelis | 36.4 /100 | #185 | Fair 12.5% |
| Immigrants | Sierra Leone | 36.3 /100 | #186 | Fair 12.5% |
| Hawaiians | 34.1 /100 | #187 | Fair 12.5% |
| Immigrants | Costa Rica | 33.3 /100 | #188 | Fair 12.5% |
| Aleuts | 33.2 /100 | #189 | Fair 12.5% |
| Immigrants | South America | 32.3 /100 | #190 | Fair 12.5% |
| Sierra Leoneans | 31.5 /100 | #191 | Fair 12.6% |
| South American Indians | 23.3 /100 | #192 | Fair 12.7% |
| Delaware | 21.4 /100 | #193 | Fair 12.7% |
Demographics Similar to Luxembourgers by Poverty
In terms of poverty, the demographic groups most similar to Luxembourgers are Immigrants from North Macedonia (10.6%, a difference of 0.080%), Eastern European (10.6%, a difference of 0.16%), Immigrants from Scotland (10.6%, a difference of 0.19%), Swedish (10.6%, a difference of 0.27%), and Italian (10.6%, a difference of 0.31%).
| Demographics | Rating | Rank | Poverty |
| Immigrants | Bolivia | 99.8 /100 | #14 | Exceptional 10.4% |
| Bolivians | 99.8 /100 | #15 | Exceptional 10.4% |
| Lithuanians | 99.8 /100 | #16 | Exceptional 10.5% |
| Norwegians | 99.8 /100 | #17 | Exceptional 10.5% |
| Latvians | 99.8 /100 | #18 | Exceptional 10.5% |
| Immigrants | Scotland | 99.7 /100 | #19 | Exceptional 10.6% |
| Immigrants | North Macedonia | 99.7 /100 | #20 | Exceptional 10.6% |
| Luxembourgers | 99.7 /100 | #21 | Exceptional 10.6% |
| Eastern Europeans | 99.7 /100 | #22 | Exceptional 10.6% |
| Swedes | 99.7 /100 | #23 | Exceptional 10.6% |
| Italians | 99.7 /100 | #24 | Exceptional 10.6% |
| Croatians | 99.6 /100 | #25 | Exceptional 10.6% |
| Burmese | 99.6 /100 | #26 | Exceptional 10.7% |
| Immigrants | Northern Europe | 99.6 /100 | #27 | Exceptional 10.7% |
| Immigrants | Korea | 99.5 /100 | #28 | Exceptional 10.7% |