Black/African American vs Immigrants from Kazakhstan Poverty
COMPARE
Black/African American
Immigrants from Kazakhstan
Poverty
Poverty Comparison
Blacks/African Americans
Immigrants from Kazakhstan
17.3%
POVERTY
0.0/ 100
METRIC RATING
329th/ 347
METRIC RANK
12.0%
POVERTY
72.3/ 100
METRIC RATING
150th/ 347
METRIC RANK
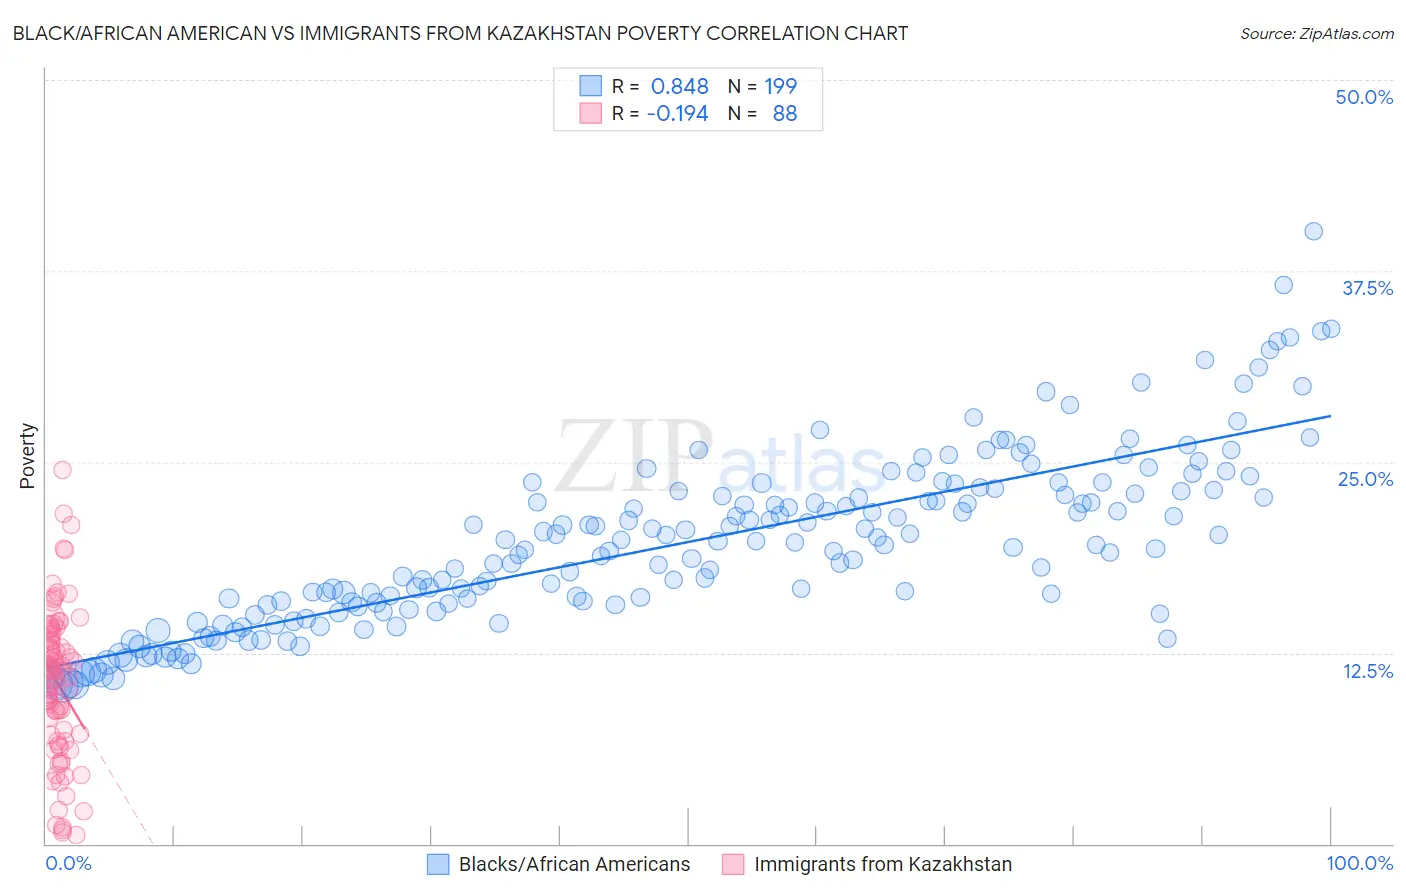
Black/African American vs Immigrants from Kazakhstan Poverty Correlation Chart
The statistical analysis conducted on geographies consisting of 565,229,178 people shows a very strong positive correlation between the proportion of Blacks/African Americans and poverty level in the United States with a correlation coefficient (R) of 0.848 and weighted average of 17.3%. Similarly, the statistical analysis conducted on geographies consisting of 124,425,744 people shows a poor negative correlation between the proportion of Immigrants from Kazakhstan and poverty level in the United States with a correlation coefficient (R) of -0.194 and weighted average of 12.0%, a difference of 43.4%.
Poverty Correlation Summary
| Measurement | Black/African American | Immigrants from Kazakhstan |
| Minimum | 10.3% | 0.57% |
| Maximum | 40.1% | 24.5% |
| Range | 29.8% | 23.9% |
| Mean | 19.7% | 10.5% |
| Median | 19.6% | 11.3% |
| Interquartile 25% (IQ1) | 15.7% | 6.9% |
| Interquartile 75% (IQ3) | 23.1% | 13.6% |
| Interquartile Range (IQR) | 7.4% | 6.6% |
| Standard Deviation (Sample) | 5.6% | 4.9% |
| Standard Deviation (Population) | 5.6% | 4.9% |
Similar Demographics by Poverty
Demographics Similar to Blacks/African Americans by Poverty
In terms of poverty, the demographic groups most similar to Blacks/African Americans are Ute (16.9%, a difference of 2.0%), Dominican (17.6%, a difference of 2.3%), Kiowa (16.8%, a difference of 2.5%), Paiute (16.7%, a difference of 3.0%), and Immigrants from Dominican Republic (17.8%, a difference of 3.2%).
| Demographics | Rating | Rank | Poverty |
| Menominee | 0.0 /100 | #322 | Tragic 16.4% |
| Colville | 0.0 /100 | #323 | Tragic 16.6% |
| Yakama | 0.0 /100 | #324 | Tragic 16.7% |
| Central American Indians | 0.0 /100 | #325 | Tragic 16.7% |
| Paiute | 0.0 /100 | #326 | Tragic 16.7% |
| Kiowa | 0.0 /100 | #327 | Tragic 16.8% |
| Ute | 0.0 /100 | #328 | Tragic 16.9% |
| Blacks/African Americans | 0.0 /100 | #329 | Tragic 17.3% |
| Dominicans | 0.0 /100 | #330 | Tragic 17.6% |
| Immigrants | Dominican Republic | 0.0 /100 | #331 | Tragic 17.8% |
| Natives/Alaskans | 0.0 /100 | #332 | Tragic 18.1% |
| Houma | 0.0 /100 | #333 | Tragic 18.4% |
| Apache | 0.0 /100 | #334 | Tragic 18.4% |
| Cheyenne | 0.0 /100 | #335 | Tragic 18.9% |
| Pueblo | 0.0 /100 | #336 | Tragic 19.4% |
Demographics Similar to Immigrants from Kazakhstan by Poverty
In terms of poverty, the demographic groups most similar to Immigrants from Kazakhstan are Samoan (12.0%, a difference of 0.040%), Immigrants from Germany (12.0%, a difference of 0.050%), Immigrants from Malaysia (12.0%, a difference of 0.050%), Immigrants from Bosnia and Herzegovina (12.0%, a difference of 0.17%), and Afghan (12.0%, a difference of 0.33%).
| Demographics | Rating | Rank | Poverty |
| Brazilians | 79.7 /100 | #143 | Good 11.9% |
| Icelanders | 77.9 /100 | #144 | Good 11.9% |
| Syrians | 75.1 /100 | #145 | Good 12.0% |
| Afghans | 74.9 /100 | #146 | Good 12.0% |
| Immigrants | Bosnia and Herzegovina | 73.7 /100 | #147 | Good 12.0% |
| Immigrants | Germany | 72.7 /100 | #148 | Good 12.0% |
| Immigrants | Malaysia | 72.7 /100 | #149 | Good 12.0% |
| Immigrants | Kazakhstan | 72.3 /100 | #150 | Good 12.0% |
| Samoans | 71.9 /100 | #151 | Good 12.0% |
| Armenians | 67.6 /100 | #152 | Good 12.1% |
| Immigrants | Northern Africa | 63.9 /100 | #153 | Good 12.1% |
| Guamanians/Chamorros | 63.9 /100 | #154 | Good 12.1% |
| Hungarians | 63.6 /100 | #155 | Good 12.2% |
| Scotch-Irish | 62.6 /100 | #156 | Good 12.2% |
| Costa Ricans | 62.2 /100 | #157 | Good 12.2% |