Immigrants from Saudi Arabia vs Immigrants from Kazakhstan Wage/Income Gap
COMPARE
Immigrants from Saudi Arabia
Immigrants from Kazakhstan
Wage/Income Gap
Wage/Income Gap Comparison
Immigrants from Saudi Arabia
Immigrants from Kazakhstan
26.7%
WAGE/INCOME GAP
9.1/ 100
METRIC RATING
218th/ 347
METRIC RANK
26.0%
WAGE/INCOME GAP
35.2/ 100
METRIC RATING
183rd/ 347
METRIC RANK
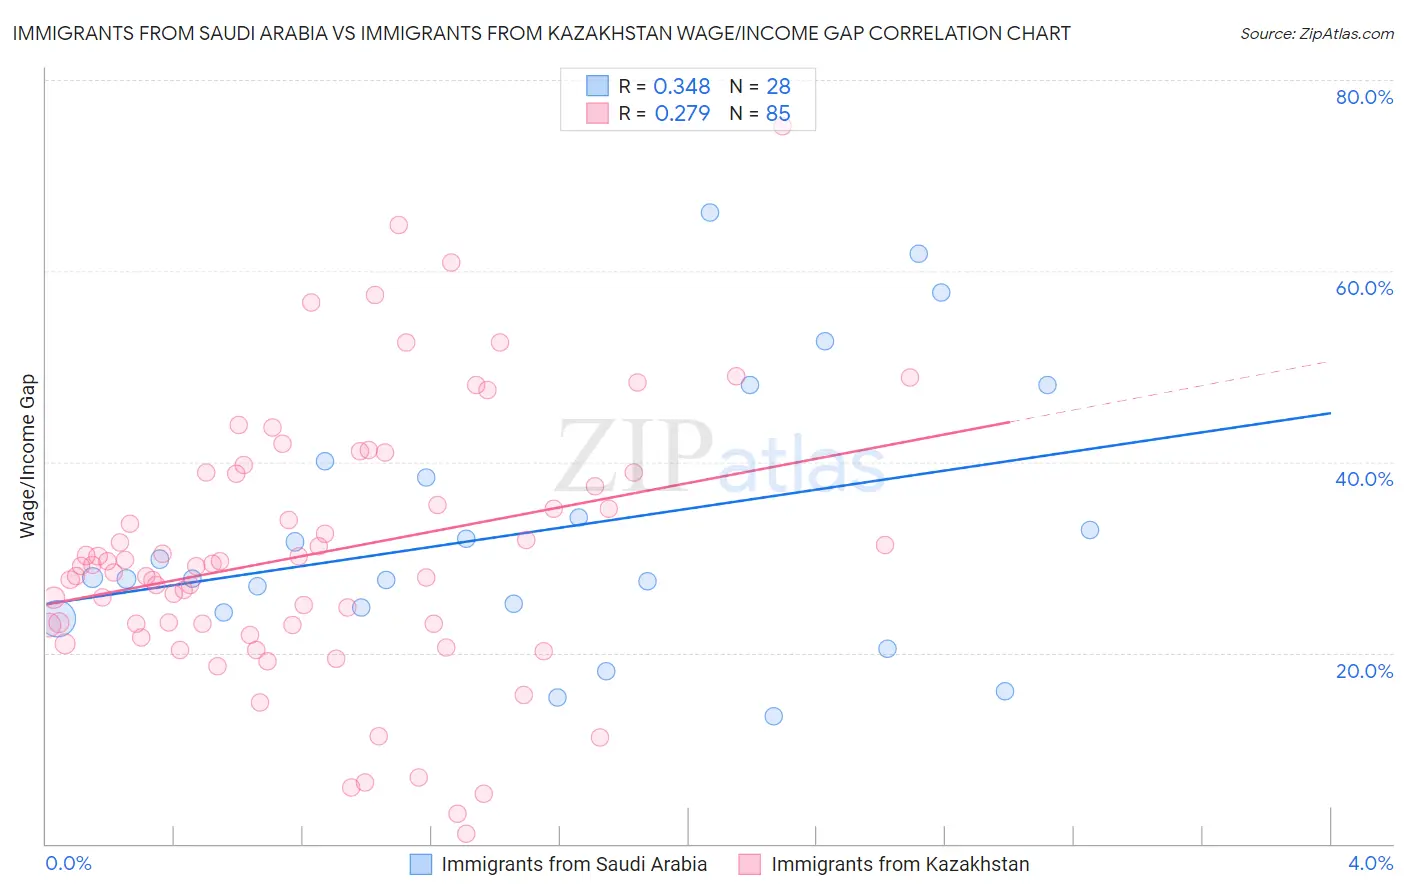
Immigrants from Saudi Arabia vs Immigrants from Kazakhstan Wage/Income Gap Correlation Chart
The statistical analysis conducted on geographies consisting of 164,286,735 people shows a mild positive correlation between the proportion of Immigrants from Saudi Arabia and wage/income gap percentage in the United States with a correlation coefficient (R) of 0.348 and weighted average of 26.7%. Similarly, the statistical analysis conducted on geographies consisting of 124,424,213 people shows a weak positive correlation between the proportion of Immigrants from Kazakhstan and wage/income gap percentage in the United States with a correlation coefficient (R) of 0.279 and weighted average of 26.0%, a difference of 2.7%.
Wage/Income Gap Correlation Summary
| Measurement | Immigrants from Saudi Arabia | Immigrants from Kazakhstan |
| Minimum | 13.4% | 1.1% |
| Maximum | 66.1% | 75.1% |
| Range | 52.7% | 74.1% |
| Mean | 32.8% | 30.4% |
| Median | 27.8% | 29.1% |
| Interquartile 25% (IQ1) | 24.5% | 22.9% |
| Interquartile 75% (IQ3) | 39.2% | 38.8% |
| Interquartile Range (IQR) | 14.8% | 15.9% |
| Standard Deviation (Sample) | 14.0% | 13.9% |
| Standard Deviation (Population) | 13.8% | 13.8% |
Similar Demographics by Wage/Income Gap
Demographics Similar to Immigrants from Saudi Arabia by Wage/Income Gap
In terms of wage/income gap, the demographic groups most similar to Immigrants from Saudi Arabia are Brazilian (26.7%, a difference of 0.030%), Immigrants from Poland (26.7%, a difference of 0.030%), Immigrants from Latvia (26.7%, a difference of 0.040%), Immigrants from Portugal (26.7%, a difference of 0.080%), and Immigrants from Spain (26.8%, a difference of 0.11%).
| Demographics | Rating | Rank | Wage/Income Gap |
| Mongolians | 11.4 /100 | #211 | Poor 26.6% |
| Iraqis | 11.2 /100 | #212 | Poor 26.6% |
| Immigrants | Iraq | 10.3 /100 | #213 | Poor 26.7% |
| Immigrants | China | 10.3 /100 | #214 | Poor 26.7% |
| Yugoslavians | 9.7 /100 | #215 | Tragic 26.7% |
| Immigrants | Portugal | 9.5 /100 | #216 | Tragic 26.7% |
| Brazilians | 9.2 /100 | #217 | Tragic 26.7% |
| Immigrants | Saudi Arabia | 9.1 /100 | #218 | Tragic 26.7% |
| Immigrants | Poland | 8.9 /100 | #219 | Tragic 26.7% |
| Immigrants | Latvia | 8.9 /100 | #220 | Tragic 26.7% |
| Immigrants | Spain | 8.5 /100 | #221 | Tragic 26.8% |
| Bolivians | 8.3 /100 | #222 | Tragic 26.8% |
| Jordanians | 8.0 /100 | #223 | Tragic 26.8% |
| Immigrants | Argentina | 7.2 /100 | #224 | Tragic 26.8% |
| Immigrants | Ireland | 6.5 /100 | #225 | Tragic 26.9% |
Demographics Similar to Immigrants from Kazakhstan by Wage/Income Gap
In terms of wage/income gap, the demographic groups most similar to Immigrants from Kazakhstan are Immigrants from Serbia (26.0%, a difference of 0.010%), Mexican (26.0%, a difference of 0.060%), Immigrants from Bolivia (26.0%, a difference of 0.090%), Pakistani (26.1%, a difference of 0.11%), and Immigrants from Indonesia (26.1%, a difference of 0.19%).
| Demographics | Rating | Rank | Wage/Income Gap |
| Paraguayans | 46.7 /100 | #176 | Average 25.8% |
| Cambodians | 45.1 /100 | #177 | Average 25.8% |
| Chinese | 42.0 /100 | #178 | Average 25.9% |
| Samoans | 38.6 /100 | #179 | Fair 26.0% |
| Guamanians/Chamorros | 38.0 /100 | #180 | Fair 26.0% |
| Immigrants | Bolivia | 36.4 /100 | #181 | Fair 26.0% |
| Immigrants | Serbia | 35.4 /100 | #182 | Fair 26.0% |
| Immigrants | Kazakhstan | 35.2 /100 | #183 | Fair 26.0% |
| Mexicans | 34.4 /100 | #184 | Fair 26.0% |
| Pakistanis | 33.7 /100 | #185 | Fair 26.1% |
| Immigrants | Indonesia | 32.5 /100 | #186 | Fair 26.1% |
| Palestinians | 29.9 /100 | #187 | Fair 26.1% |
| Immigrants | Egypt | 29.9 /100 | #188 | Fair 26.1% |
| Immigrants | Moldova | 26.6 /100 | #189 | Fair 26.2% |
| Immigrants | Croatia | 24.8 /100 | #190 | Fair 26.2% |