Alaska Native vs Immigrants from Peru Child Poverty Under the Age of 5
COMPARE
Alaska Native
Immigrants from Peru
Child Poverty Under the Age of 5
Child Poverty Under the Age of 5 Comparison
Alaska Natives
Immigrants from Peru
19.6%
CHILD POVERTY UNDER THE AGE OF 5
0.5/ 100
METRIC RATING
241st/ 347
METRIC RANK
16.1%
CHILD POVERTY UNDER THE AGE OF 5
92.6/ 100
METRIC RATING
120th/ 347
METRIC RANK
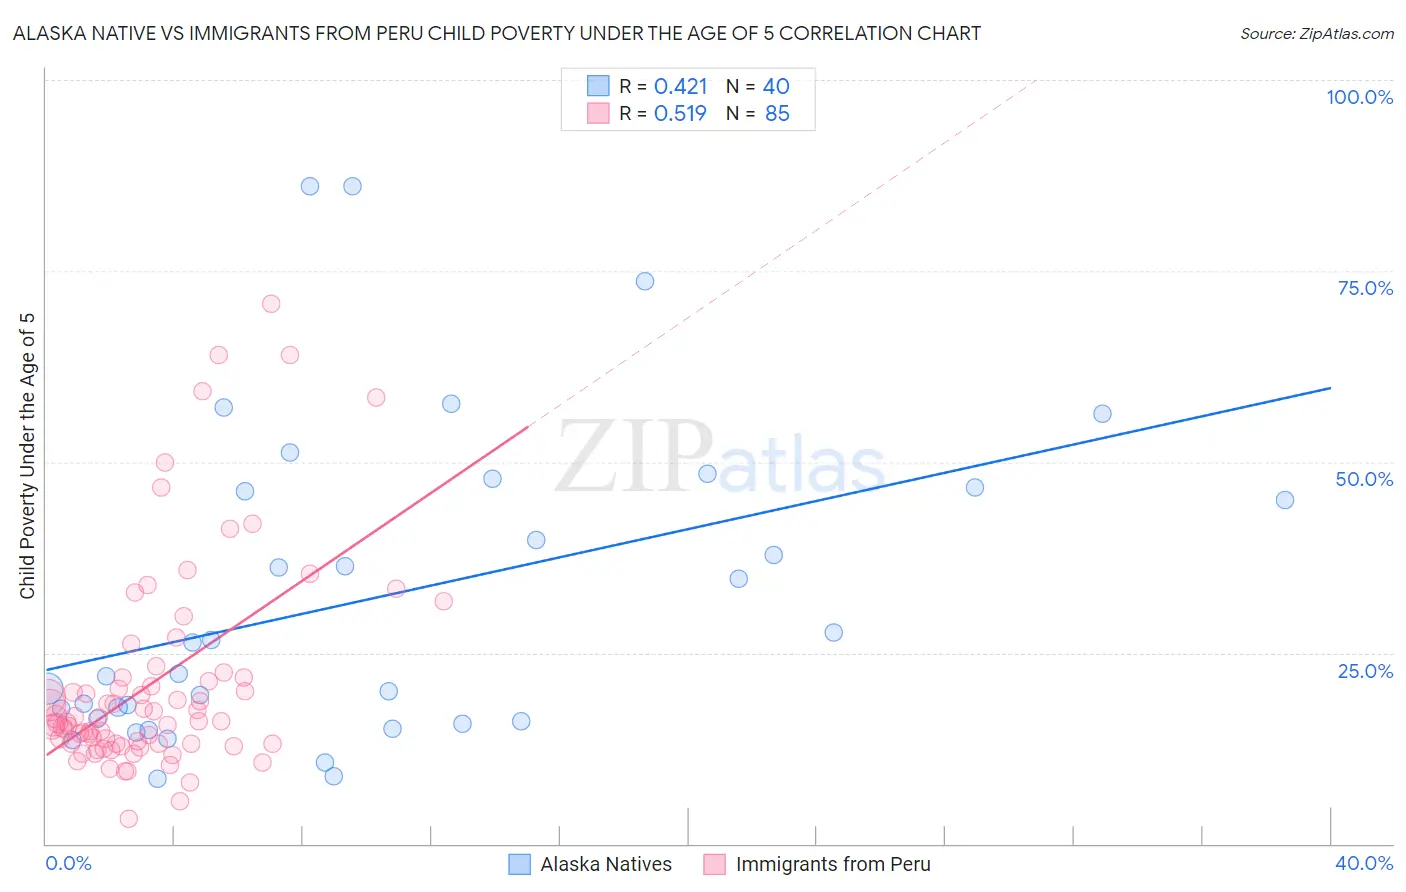
Alaska Native vs Immigrants from Peru Child Poverty Under the Age of 5 Correlation Chart
The statistical analysis conducted on geographies consisting of 76,221,903 people shows a moderate positive correlation between the proportion of Alaska Natives and poverty level among children under the age of 5 in the United States with a correlation coefficient (R) of 0.421 and weighted average of 19.6%. Similarly, the statistical analysis conducted on geographies consisting of 318,381,323 people shows a substantial positive correlation between the proportion of Immigrants from Peru and poverty level among children under the age of 5 in the United States with a correlation coefficient (R) of 0.519 and weighted average of 16.1%, a difference of 21.7%.
Child Poverty Under the Age of 5 Correlation Summary
| Measurement | Alaska Native | Immigrants from Peru |
| Minimum | 8.4% | 3.3% |
| Maximum | 86.0% | 70.7% |
| Range | 77.6% | 67.3% |
| Mean | 32.3% | 21.0% |
| Median | 24.3% | 16.1% |
| Interquartile 25% (IQ1) | 16.2% | 13.1% |
| Interquartile 75% (IQ3) | 46.4% | 21.7% |
| Interquartile Range (IQR) | 30.2% | 8.6% |
| Standard Deviation (Sample) | 20.5% | 13.8% |
| Standard Deviation (Population) | 20.3% | 13.7% |
Similar Demographics by Child Poverty Under the Age of 5
Demographics Similar to Alaska Natives by Child Poverty Under the Age of 5
In terms of child poverty under the age of 5, the demographic groups most similar to Alaska Natives are Immigrants from Ecuador (19.6%, a difference of 0.060%), Immigrants from Guyana (19.6%, a difference of 0.11%), Osage (19.6%, a difference of 0.22%), Immigrants from Ghana (19.6%, a difference of 0.24%), and Immigrants from Western Africa (19.7%, a difference of 0.42%).
| Demographics | Rating | Rank | Child Poverty Under the Age of 5 |
| Immigrants | Micronesia | 0.9 /100 | #234 | Tragic 19.4% |
| Immigrants | Laos | 0.8 /100 | #235 | Tragic 19.4% |
| Immigrants | Trinidad and Tobago | 0.8 /100 | #236 | Tragic 19.4% |
| Immigrants | Cabo Verde | 0.6 /100 | #237 | Tragic 19.5% |
| Salvadorans | 0.6 /100 | #238 | Tragic 19.5% |
| Vietnamese | 0.6 /100 | #239 | Tragic 19.5% |
| Immigrants | Ecuador | 0.5 /100 | #240 | Tragic 19.6% |
| Alaska Natives | 0.5 /100 | #241 | Tragic 19.6% |
| Immigrants | Guyana | 0.5 /100 | #242 | Tragic 19.6% |
| Osage | 0.5 /100 | #243 | Tragic 19.6% |
| Immigrants | Ghana | 0.5 /100 | #244 | Tragic 19.6% |
| Immigrants | Western Africa | 0.4 /100 | #245 | Tragic 19.7% |
| Cree | 0.4 /100 | #246 | Tragic 19.7% |
| Guyanese | 0.4 /100 | #247 | Tragic 19.7% |
| Marshallese | 0.4 /100 | #248 | Tragic 19.7% |
Demographics Similar to Immigrants from Peru by Child Poverty Under the Age of 5
In terms of child poverty under the age of 5, the demographic groups most similar to Immigrants from Peru are Mongolian (16.1%, a difference of 0.010%), Immigrants from Southern Europe (16.1%, a difference of 0.20%), Austrian (16.1%, a difference of 0.23%), Swiss (16.1%, a difference of 0.24%), and Immigrants from Jordan (16.1%, a difference of 0.26%).
| Demographics | Rating | Rank | Child Poverty Under the Age of 5 |
| Puget Sound Salish | 94.1 /100 | #113 | Exceptional 16.0% |
| Immigrants | Kuwait | 93.9 /100 | #114 | Exceptional 16.0% |
| Albanians | 93.8 /100 | #115 | Exceptional 16.0% |
| Immigrants | Austria | 93.5 /100 | #116 | Exceptional 16.0% |
| Basques | 93.4 /100 | #117 | Exceptional 16.0% |
| Immigrants | Denmark | 93.4 /100 | #118 | Exceptional 16.0% |
| Immigrants | Jordan | 93.2 /100 | #119 | Exceptional 16.1% |
| Immigrants | Peru | 92.6 /100 | #120 | Exceptional 16.1% |
| Mongolians | 92.5 /100 | #121 | Exceptional 16.1% |
| Immigrants | Southern Europe | 92.0 /100 | #122 | Exceptional 16.1% |
| Austrians | 92.0 /100 | #123 | Exceptional 16.1% |
| Swiss | 92.0 /100 | #124 | Exceptional 16.1% |
| Native Hawaiians | 91.8 /100 | #125 | Exceptional 16.2% |
| Immigrants | Albania | 91.8 /100 | #126 | Exceptional 16.2% |
| Immigrants | England | 91.5 /100 | #127 | Exceptional 16.2% |