Immigrants from Oceania vs Immigrants from Kenya Child Poverty Under the Age of 5
COMPARE
Immigrants from Oceania
Immigrants from Kenya
Child Poverty Under the Age of 5
Child Poverty Under the Age of 5 Comparison
Immigrants from Oceania
Immigrants from Kenya
16.9%
CHILD POVERTY UNDER THE AGE OF 5
67.6/ 100
METRIC RATING
164th/ 347
METRIC RANK
17.9%
CHILD POVERTY UNDER THE AGE OF 5
20.0/ 100
METRIC RATING
197th/ 347
METRIC RANK
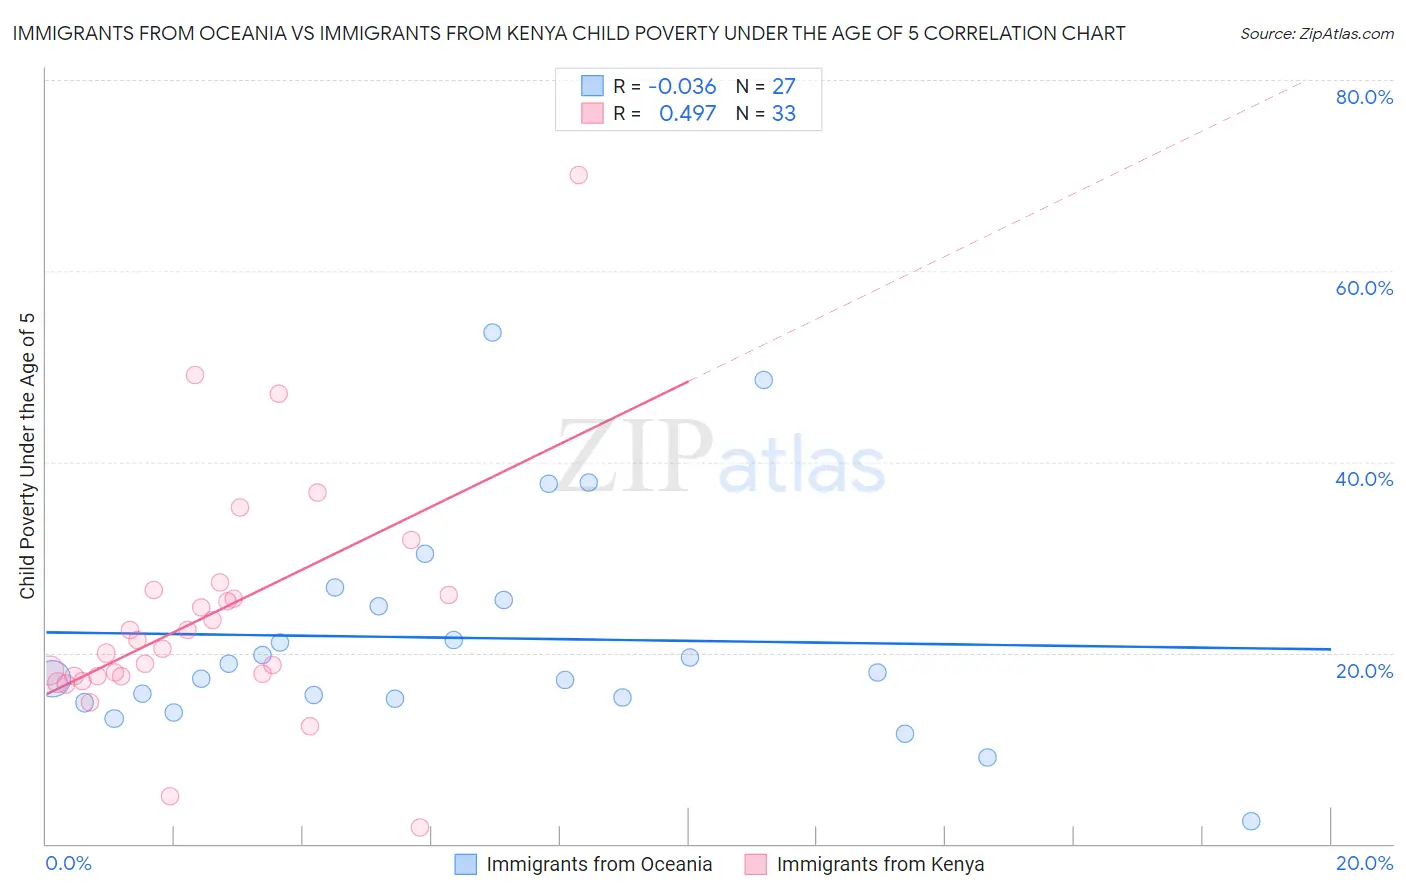
Immigrants from Oceania vs Immigrants from Kenya Child Poverty Under the Age of 5 Correlation Chart
The statistical analysis conducted on geographies consisting of 294,567,604 people shows no correlation between the proportion of Immigrants from Oceania and poverty level among children under the age of 5 in the United States with a correlation coefficient (R) of -0.036 and weighted average of 16.9%. Similarly, the statistical analysis conducted on geographies consisting of 213,748,262 people shows a moderate positive correlation between the proportion of Immigrants from Kenya and poverty level among children under the age of 5 in the United States with a correlation coefficient (R) of 0.497 and weighted average of 17.9%, a difference of 5.6%.
Child Poverty Under the Age of 5 Correlation Summary
| Measurement | Immigrants from Oceania | Immigrants from Kenya |
| Minimum | 2.4% | 1.7% |
| Maximum | 53.5% | 70.0% |
| Range | 51.2% | 68.3% |
| Mean | 21.6% | 23.8% |
| Median | 18.0% | 20.4% |
| Interquartile 25% (IQ1) | 15.2% | 17.5% |
| Interquartile 75% (IQ3) | 25.6% | 26.3% |
| Interquartile Range (IQR) | 10.4% | 8.8% |
| Standard Deviation (Sample) | 11.5% | 12.8% |
| Standard Deviation (Population) | 11.3% | 12.6% |
Similar Demographics by Child Poverty Under the Age of 5
Demographics Similar to Immigrants from Oceania by Child Poverty Under the Age of 5
In terms of child poverty under the age of 5, the demographic groups most similar to Immigrants from Oceania are Immigrants from Colombia (16.9%, a difference of 0.090%), Scottish (16.9%, a difference of 0.12%), Costa Rican (16.9%, a difference of 0.27%), English (16.8%, a difference of 0.34%), and Slavic (17.0%, a difference of 0.43%).
| Demographics | Rating | Rank | Child Poverty Under the Age of 5 |
| Venezuelans | 73.7 /100 | #157 | Good 16.8% |
| Czechoslovakians | 72.5 /100 | #158 | Good 16.8% |
| Immigrants | Syria | 72.3 /100 | #159 | Good 16.8% |
| Irish | 72.0 /100 | #160 | Good 16.8% |
| English | 70.4 /100 | #161 | Good 16.8% |
| Costa Ricans | 69.8 /100 | #162 | Good 16.9% |
| Scottish | 68.6 /100 | #163 | Good 16.9% |
| Immigrants | Oceania | 67.6 /100 | #164 | Good 16.9% |
| Immigrants | Colombia | 66.9 /100 | #165 | Good 16.9% |
| Slavs | 64.0 /100 | #166 | Good 17.0% |
| Immigrants | Uzbekistan | 62.0 /100 | #167 | Good 17.0% |
| Uruguayans | 60.5 /100 | #168 | Good 17.0% |
| Immigrants | South America | 60.0 /100 | #169 | Good 17.1% |
| Immigrants | Western Asia | 59.2 /100 | #170 | Average 17.1% |
| Immigrants | Morocco | 58.9 /100 | #171 | Average 17.1% |
Demographics Similar to Immigrants from Kenya by Child Poverty Under the Age of 5
In terms of child poverty under the age of 5, the demographic groups most similar to Immigrants from Kenya are Celtic (17.9%, a difference of 0.28%), Hungarian (17.9%, a difference of 0.28%), Immigrants from Portugal (17.8%, a difference of 0.33%), Sierra Leonean (17.7%, a difference of 0.60%), and French Canadian (17.7%, a difference of 0.67%).
| Demographics | Rating | Rank | Child Poverty Under the Age of 5 |
| Slovaks | 29.2 /100 | #190 | Fair 17.6% |
| Immigrants | Afghanistan | 27.9 /100 | #191 | Fair 17.7% |
| Immigrants | Uruguay | 27.8 /100 | #192 | Fair 17.7% |
| Immigrants | Uganda | 25.0 /100 | #193 | Fair 17.7% |
| French Canadians | 24.6 /100 | #194 | Fair 17.7% |
| Sierra Leoneans | 24.1 /100 | #195 | Fair 17.7% |
| Immigrants | Portugal | 22.2 /100 | #196 | Fair 17.8% |
| Immigrants | Kenya | 20.0 /100 | #197 | Fair 17.9% |
| Celtics | 18.3 /100 | #198 | Poor 17.9% |
| Hungarians | 18.3 /100 | #199 | Poor 17.9% |
| Iraqis | 14.0 /100 | #200 | Poor 18.0% |
| Ugandans | 13.9 /100 | #201 | Poor 18.0% |
| Japanese | 13.8 /100 | #202 | Poor 18.1% |
| Immigrants | Cambodia | 13.7 /100 | #203 | Poor 18.1% |
| Immigrants | Eastern Africa | 13.4 /100 | #204 | Poor 18.1% |