Immigrants from Oceania vs Japanese Child Poverty Under the Age of 5
COMPARE
Immigrants from Oceania
Japanese
Child Poverty Under the Age of 5
Child Poverty Under the Age of 5 Comparison
Immigrants from Oceania
Japanese
16.9%
CHILD POVERTY UNDER THE AGE OF 5
67.6/ 100
METRIC RATING
164th/ 347
METRIC RANK
18.1%
CHILD POVERTY UNDER THE AGE OF 5
13.8/ 100
METRIC RATING
202nd/ 347
METRIC RANK
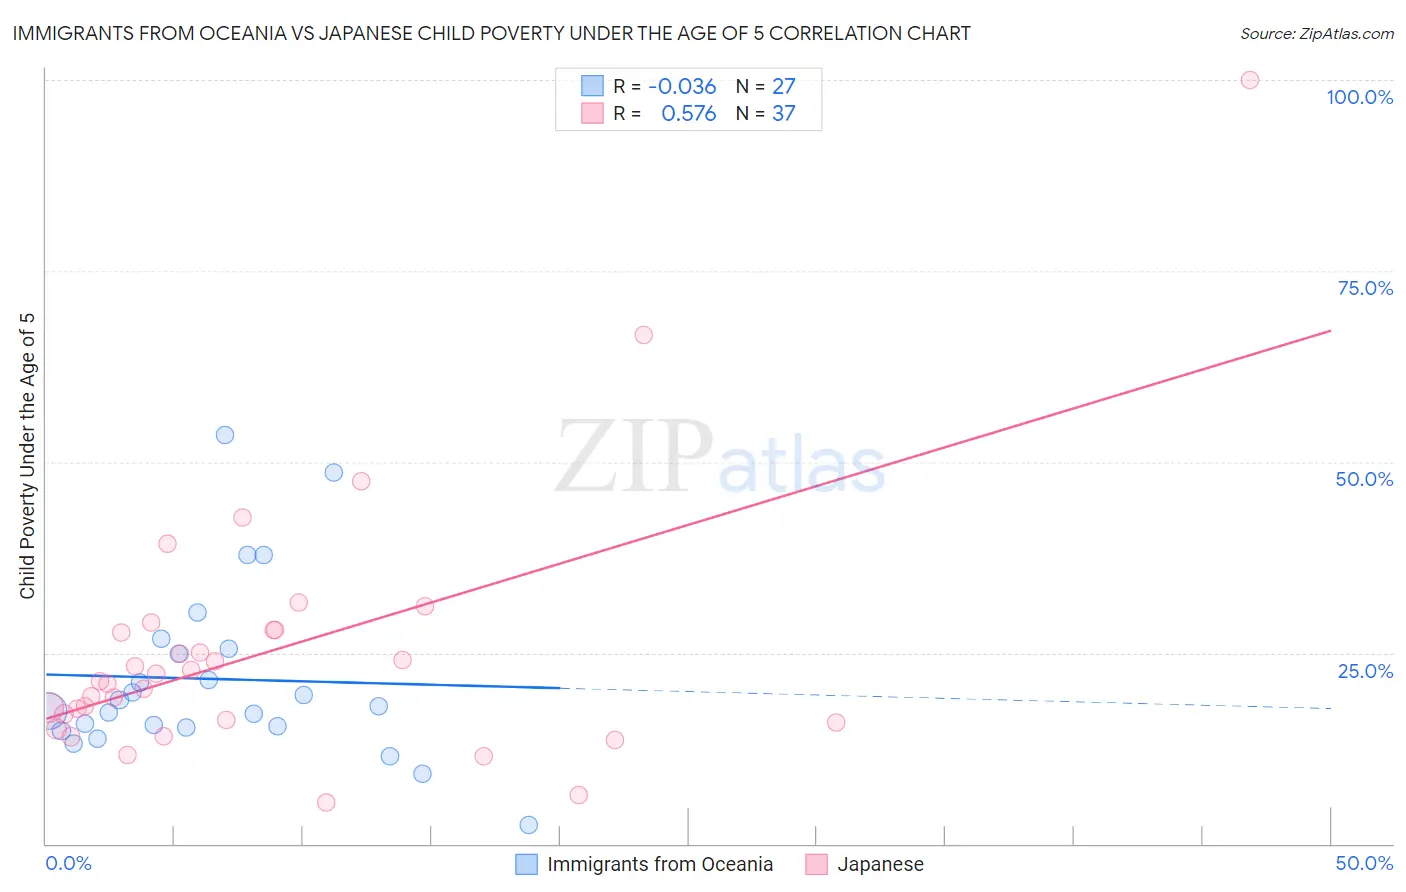
Immigrants from Oceania vs Japanese Child Poverty Under the Age of 5 Correlation Chart
The statistical analysis conducted on geographies consisting of 294,567,604 people shows no correlation between the proportion of Immigrants from Oceania and poverty level among children under the age of 5 in the United States with a correlation coefficient (R) of -0.036 and weighted average of 16.9%. Similarly, the statistical analysis conducted on geographies consisting of 243,928,105 people shows a substantial positive correlation between the proportion of Japanese and poverty level among children under the age of 5 in the United States with a correlation coefficient (R) of 0.576 and weighted average of 18.1%, a difference of 6.8%.
Child Poverty Under the Age of 5 Correlation Summary
| Measurement | Immigrants from Oceania | Japanese |
| Minimum | 2.4% | 5.4% |
| Maximum | 53.5% | 100.0% |
| Range | 51.2% | 94.6% |
| Mean | 21.6% | 25.2% |
| Median | 18.0% | 21.3% |
| Interquartile 25% (IQ1) | 15.2% | 16.0% |
| Interquartile 75% (IQ3) | 25.6% | 28.1% |
| Interquartile Range (IQR) | 10.4% | 12.0% |
| Standard Deviation (Sample) | 11.5% | 17.1% |
| Standard Deviation (Population) | 11.3% | 16.9% |
Similar Demographics by Child Poverty Under the Age of 5
Demographics Similar to Immigrants from Oceania by Child Poverty Under the Age of 5
In terms of child poverty under the age of 5, the demographic groups most similar to Immigrants from Oceania are Immigrants from Colombia (16.9%, a difference of 0.090%), Scottish (16.9%, a difference of 0.12%), Costa Rican (16.9%, a difference of 0.27%), English (16.8%, a difference of 0.34%), and Slavic (17.0%, a difference of 0.43%).
| Demographics | Rating | Rank | Child Poverty Under the Age of 5 |
| Venezuelans | 73.7 /100 | #157 | Good 16.8% |
| Czechoslovakians | 72.5 /100 | #158 | Good 16.8% |
| Immigrants | Syria | 72.3 /100 | #159 | Good 16.8% |
| Irish | 72.0 /100 | #160 | Good 16.8% |
| English | 70.4 /100 | #161 | Good 16.8% |
| Costa Ricans | 69.8 /100 | #162 | Good 16.9% |
| Scottish | 68.6 /100 | #163 | Good 16.9% |
| Immigrants | Oceania | 67.6 /100 | #164 | Good 16.9% |
| Immigrants | Colombia | 66.9 /100 | #165 | Good 16.9% |
| Slavs | 64.0 /100 | #166 | Good 17.0% |
| Immigrants | Uzbekistan | 62.0 /100 | #167 | Good 17.0% |
| Uruguayans | 60.5 /100 | #168 | Good 17.0% |
| Immigrants | South America | 60.0 /100 | #169 | Good 17.1% |
| Immigrants | Western Asia | 59.2 /100 | #170 | Average 17.1% |
| Immigrants | Morocco | 58.9 /100 | #171 | Average 17.1% |
Demographics Similar to Japanese by Child Poverty Under the Age of 5
In terms of child poverty under the age of 5, the demographic groups most similar to Japanese are Ugandan (18.0%, a difference of 0.020%), Immigrants from Cambodia (18.1%, a difference of 0.020%), Iraqi (18.0%, a difference of 0.030%), Immigrants from Eastern Africa (18.1%, a difference of 0.080%), and Spaniard (18.1%, a difference of 0.21%).
| Demographics | Rating | Rank | Child Poverty Under the Age of 5 |
| Sierra Leoneans | 24.1 /100 | #195 | Fair 17.7% |
| Immigrants | Portugal | 22.2 /100 | #196 | Fair 17.8% |
| Immigrants | Kenya | 20.0 /100 | #197 | Fair 17.9% |
| Celtics | 18.3 /100 | #198 | Poor 17.9% |
| Hungarians | 18.3 /100 | #199 | Poor 17.9% |
| Iraqis | 14.0 /100 | #200 | Poor 18.0% |
| Ugandans | 13.9 /100 | #201 | Poor 18.0% |
| Japanese | 13.8 /100 | #202 | Poor 18.1% |
| Immigrants | Cambodia | 13.7 /100 | #203 | Poor 18.1% |
| Immigrants | Eastern Africa | 13.4 /100 | #204 | Poor 18.1% |
| Spaniards | 12.8 /100 | #205 | Poor 18.1% |
| Whites/Caucasians | 12.6 /100 | #206 | Poor 18.1% |
| Immigrants | Immigrants | 9.9 /100 | #207 | Tragic 18.2% |
| Scotch-Irish | 9.8 /100 | #208 | Tragic 18.2% |
| Spanish | 9.8 /100 | #209 | Tragic 18.2% |