Immigrants from Oceania vs Immigrants from Senegal Child Poverty Under the Age of 5
COMPARE
Immigrants from Oceania
Immigrants from Senegal
Child Poverty Under the Age of 5
Child Poverty Under the Age of 5 Comparison
Immigrants from Oceania
Immigrants from Senegal
16.9%
CHILD POVERTY UNDER THE AGE OF 5
67.6/ 100
METRIC RATING
164th/ 347
METRIC RANK
21.3%
CHILD POVERTY UNDER THE AGE OF 5
0.0/ 100
METRIC RATING
288th/ 347
METRIC RANK
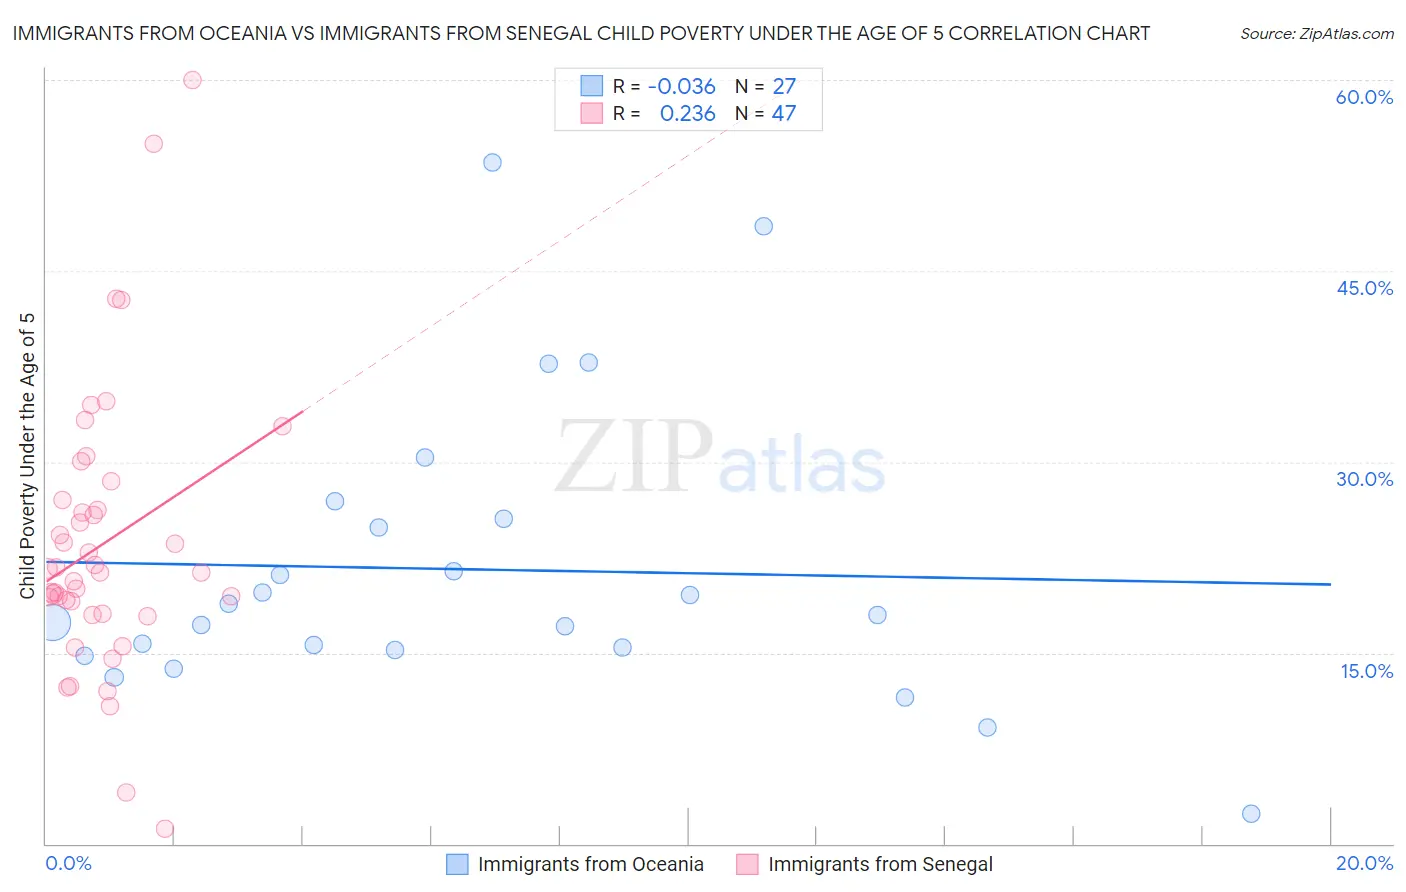
Immigrants from Oceania vs Immigrants from Senegal Child Poverty Under the Age of 5 Correlation Chart
The statistical analysis conducted on geographies consisting of 294,567,604 people shows no correlation between the proportion of Immigrants from Oceania and poverty level among children under the age of 5 in the United States with a correlation coefficient (R) of -0.036 and weighted average of 16.9%. Similarly, the statistical analysis conducted on geographies consisting of 89,495,365 people shows a weak positive correlation between the proportion of Immigrants from Senegal and poverty level among children under the age of 5 in the United States with a correlation coefficient (R) of 0.236 and weighted average of 21.3%, a difference of 25.9%.
Child Poverty Under the Age of 5 Correlation Summary
| Measurement | Immigrants from Oceania | Immigrants from Senegal |
| Minimum | 2.4% | 1.2% |
| Maximum | 53.5% | 60.0% |
| Range | 51.2% | 58.8% |
| Mean | 21.6% | 23.5% |
| Median | 18.0% | 21.4% |
| Interquartile 25% (IQ1) | 15.2% | 18.1% |
| Interquartile 75% (IQ3) | 25.6% | 27.0% |
| Interquartile Range (IQR) | 10.4% | 8.9% |
| Standard Deviation (Sample) | 11.5% | 11.0% |
| Standard Deviation (Population) | 11.3% | 10.9% |
Similar Demographics by Child Poverty Under the Age of 5
Demographics Similar to Immigrants from Oceania by Child Poverty Under the Age of 5
In terms of child poverty under the age of 5, the demographic groups most similar to Immigrants from Oceania are Immigrants from Colombia (16.9%, a difference of 0.090%), Scottish (16.9%, a difference of 0.12%), Costa Rican (16.9%, a difference of 0.27%), English (16.8%, a difference of 0.34%), and Slavic (17.0%, a difference of 0.43%).
| Demographics | Rating | Rank | Child Poverty Under the Age of 5 |
| Venezuelans | 73.7 /100 | #157 | Good 16.8% |
| Czechoslovakians | 72.5 /100 | #158 | Good 16.8% |
| Immigrants | Syria | 72.3 /100 | #159 | Good 16.8% |
| Irish | 72.0 /100 | #160 | Good 16.8% |
| English | 70.4 /100 | #161 | Good 16.8% |
| Costa Ricans | 69.8 /100 | #162 | Good 16.9% |
| Scottish | 68.6 /100 | #163 | Good 16.9% |
| Immigrants | Oceania | 67.6 /100 | #164 | Good 16.9% |
| Immigrants | Colombia | 66.9 /100 | #165 | Good 16.9% |
| Slavs | 64.0 /100 | #166 | Good 17.0% |
| Immigrants | Uzbekistan | 62.0 /100 | #167 | Good 17.0% |
| Uruguayans | 60.5 /100 | #168 | Good 17.0% |
| Immigrants | South America | 60.0 /100 | #169 | Good 17.1% |
| Immigrants | Western Asia | 59.2 /100 | #170 | Average 17.1% |
| Immigrants | Morocco | 58.9 /100 | #171 | Average 17.1% |
Demographics Similar to Immigrants from Senegal by Child Poverty Under the Age of 5
In terms of child poverty under the age of 5, the demographic groups most similar to Immigrants from Senegal are Immigrants from Haiti (21.3%, a difference of 0.070%), Immigrants from Zaire (21.3%, a difference of 0.17%), Immigrants from Latin America (21.2%, a difference of 0.27%), Haitian (21.2%, a difference of 0.34%), and Immigrants from Caribbean (21.4%, a difference of 0.48%).
| Demographics | Rating | Rank | Child Poverty Under the Age of 5 |
| Senegalese | 0.0 /100 | #281 | Tragic 20.9% |
| Potawatomi | 0.0 /100 | #282 | Tragic 21.0% |
| Comanche | 0.0 /100 | #283 | Tragic 21.0% |
| Somalis | 0.0 /100 | #284 | Tragic 21.1% |
| Haitians | 0.0 /100 | #285 | Tragic 21.2% |
| Immigrants | Latin America | 0.0 /100 | #286 | Tragic 21.2% |
| Immigrants | Zaire | 0.0 /100 | #287 | Tragic 21.3% |
| Immigrants | Senegal | 0.0 /100 | #288 | Tragic 21.3% |
| Immigrants | Haiti | 0.0 /100 | #289 | Tragic 21.3% |
| Immigrants | Caribbean | 0.0 /100 | #290 | Tragic 21.4% |
| British West Indians | 0.0 /100 | #291 | Tragic 21.4% |
| Immigrants | Somalia | 0.0 /100 | #292 | Tragic 21.6% |
| Mexicans | 0.0 /100 | #293 | Tragic 21.6% |
| Guatemalans | 0.0 /100 | #294 | Tragic 21.6% |
| Cherokee | 0.0 /100 | #295 | Tragic 21.7% |