Immigrants from Oceania vs Immigrants from Syria Child Poverty Under the Age of 5
COMPARE
Immigrants from Oceania
Immigrants from Syria
Child Poverty Under the Age of 5
Child Poverty Under the Age of 5 Comparison
Immigrants from Oceania
Immigrants from Syria
16.9%
CHILD POVERTY UNDER THE AGE OF 5
67.6/ 100
METRIC RATING
164th/ 347
METRIC RANK
16.8%
CHILD POVERTY UNDER THE AGE OF 5
72.3/ 100
METRIC RATING
159th/ 347
METRIC RANK
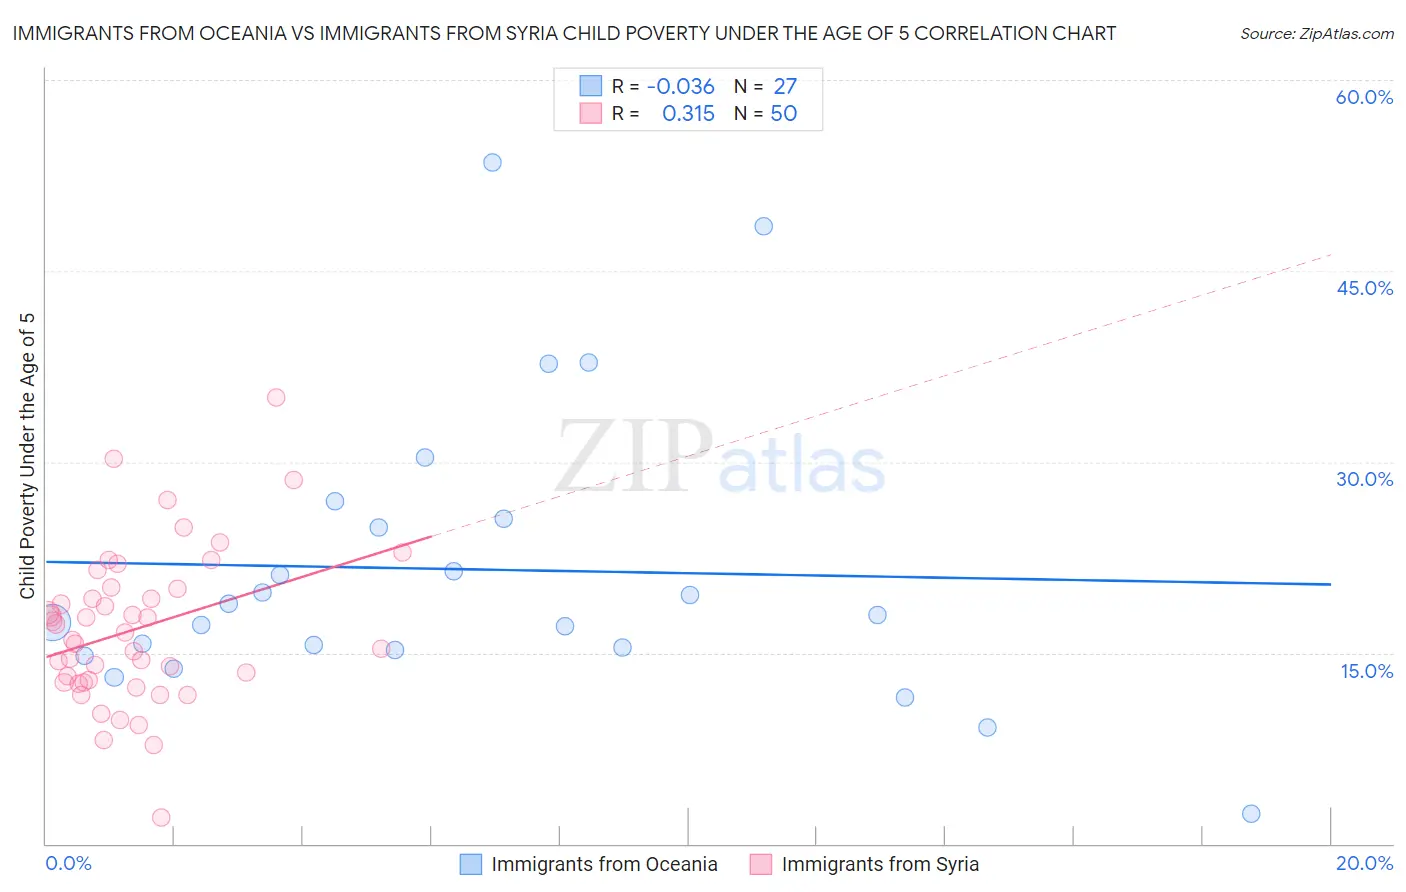
Immigrants from Oceania vs Immigrants from Syria Child Poverty Under the Age of 5 Correlation Chart
The statistical analysis conducted on geographies consisting of 294,567,604 people shows no correlation between the proportion of Immigrants from Oceania and poverty level among children under the age of 5 in the United States with a correlation coefficient (R) of -0.036 and weighted average of 16.9%. Similarly, the statistical analysis conducted on geographies consisting of 170,490,515 people shows a mild positive correlation between the proportion of Immigrants from Syria and poverty level among children under the age of 5 in the United States with a correlation coefficient (R) of 0.315 and weighted average of 16.8%, a difference of 0.58%.
Child Poverty Under the Age of 5 Correlation Summary
| Measurement | Immigrants from Oceania | Immigrants from Syria |
| Minimum | 2.4% | 2.0% |
| Maximum | 53.5% | 35.1% |
| Range | 51.2% | 33.0% |
| Mean | 21.6% | 16.9% |
| Median | 18.0% | 16.3% |
| Interquartile 25% (IQ1) | 15.2% | 12.7% |
| Interquartile 75% (IQ3) | 25.6% | 20.0% |
| Interquartile Range (IQR) | 10.4% | 7.3% |
| Standard Deviation (Sample) | 11.5% | 6.1% |
| Standard Deviation (Population) | 11.3% | 6.0% |
Demographics Similar to Immigrants from Oceania and Immigrants from Syria by Child Poverty Under the Age of 5
In terms of child poverty under the age of 5, the demographic groups most similar to Immigrants from Oceania are Immigrants from Colombia (16.9%, a difference of 0.090%), Scottish (16.9%, a difference of 0.12%), Costa Rican (16.9%, a difference of 0.27%), English (16.8%, a difference of 0.34%), and Slavic (17.0%, a difference of 0.43%). Similarly, the demographic groups most similar to Immigrants from Syria are Irish (16.8%, a difference of 0.030%), Czechoslovakian (16.8%, a difference of 0.040%), Venezuelan (16.8%, a difference of 0.20%), English (16.8%, a difference of 0.25%), and Afghan (16.8%, a difference of 0.29%).
| Demographics | Rating | Rank | Child Poverty Under the Age of 5 |
| Canadians | 77.6 /100 | #151 | Good 16.7% |
| Belgians | 77.2 /100 | #152 | Good 16.7% |
| Dutch | 77.1 /100 | #153 | Good 16.7% |
| Immigrants | Venezuela | 76.0 /100 | #154 | Good 16.7% |
| South Americans | 75.1 /100 | #155 | Good 16.7% |
| Afghans | 74.4 /100 | #156 | Good 16.8% |
| Venezuelans | 73.7 /100 | #157 | Good 16.8% |
| Czechoslovakians | 72.5 /100 | #158 | Good 16.8% |
| Immigrants | Syria | 72.3 /100 | #159 | Good 16.8% |
| Irish | 72.0 /100 | #160 | Good 16.8% |
| English | 70.4 /100 | #161 | Good 16.8% |
| Costa Ricans | 69.8 /100 | #162 | Good 16.9% |
| Scottish | 68.6 /100 | #163 | Good 16.9% |
| Immigrants | Oceania | 67.6 /100 | #164 | Good 16.9% |
| Immigrants | Colombia | 66.9 /100 | #165 | Good 16.9% |
| Slavs | 64.0 /100 | #166 | Good 17.0% |
| Immigrants | Uzbekistan | 62.0 /100 | #167 | Good 17.0% |
| Uruguayans | 60.5 /100 | #168 | Good 17.0% |
| Immigrants | South America | 60.0 /100 | #169 | Good 17.1% |
| Immigrants | Western Asia | 59.2 /100 | #170 | Average 17.1% |
| Immigrants | Morocco | 58.9 /100 | #171 | Average 17.1% |