Immigrants from Oceania vs French American Indian Child Poverty Under the Age of 5
COMPARE
Immigrants from Oceania
French American Indian
Child Poverty Under the Age of 5
Child Poverty Under the Age of 5 Comparison
Immigrants from Oceania
French American Indians
16.9%
CHILD POVERTY UNDER THE AGE OF 5
67.6/ 100
METRIC RATING
164th/ 347
METRIC RANK
20.8%
CHILD POVERTY UNDER THE AGE OF 5
0.0/ 100
METRIC RATING
280th/ 347
METRIC RANK
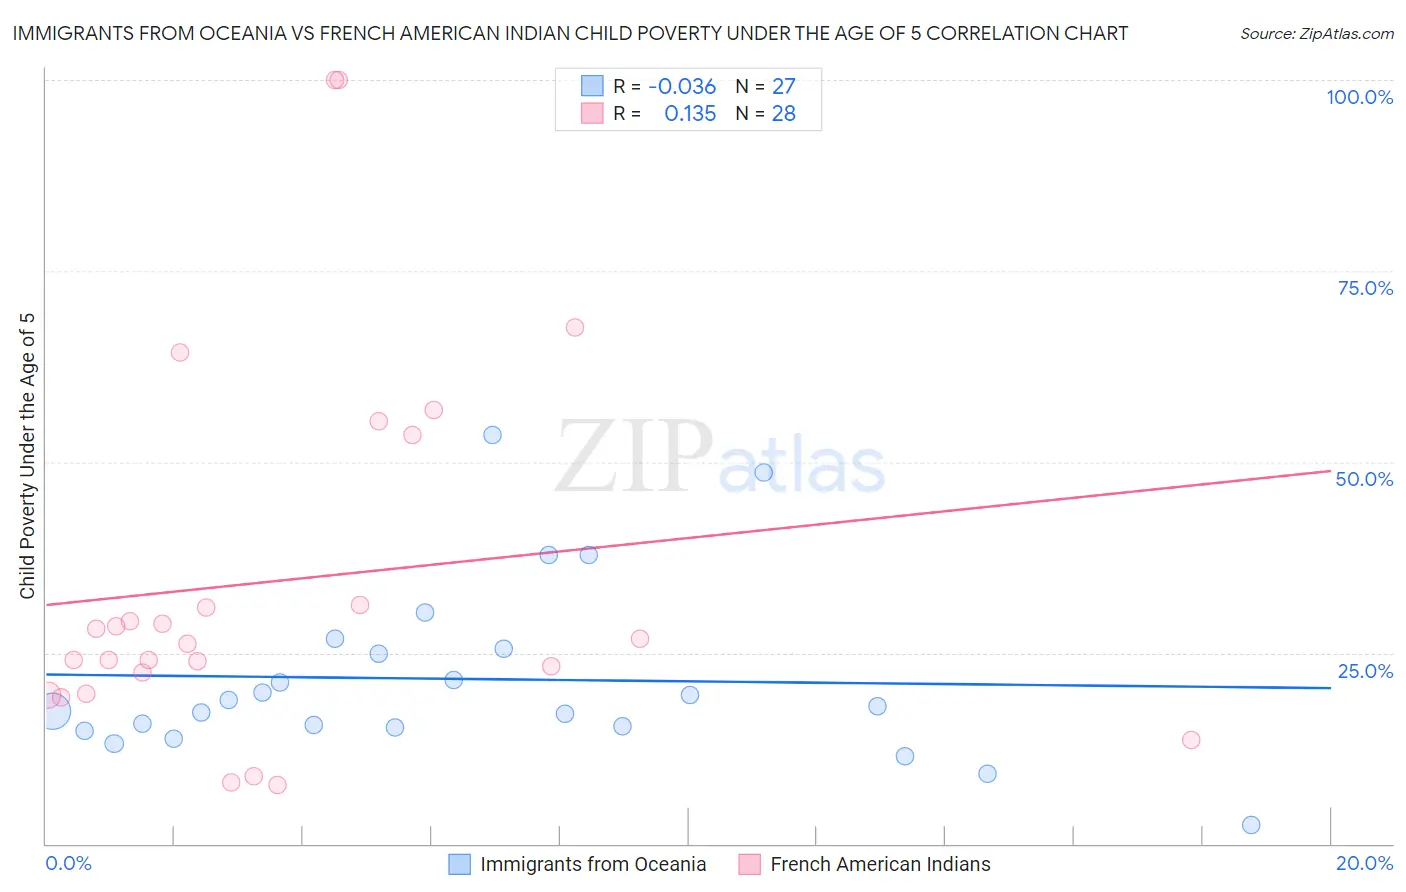
Immigrants from Oceania vs French American Indian Child Poverty Under the Age of 5 Correlation Chart
The statistical analysis conducted on geographies consisting of 294,567,604 people shows no correlation between the proportion of Immigrants from Oceania and poverty level among children under the age of 5 in the United States with a correlation coefficient (R) of -0.036 and weighted average of 16.9%. Similarly, the statistical analysis conducted on geographies consisting of 129,608,524 people shows a poor positive correlation between the proportion of French American Indians and poverty level among children under the age of 5 in the United States with a correlation coefficient (R) of 0.135 and weighted average of 20.8%, a difference of 23.3%.
Child Poverty Under the Age of 5 Correlation Summary
| Measurement | Immigrants from Oceania | French American Indian |
| Minimum | 2.4% | 7.7% |
| Maximum | 53.5% | 100.0% |
| Range | 51.2% | 92.3% |
| Mean | 21.6% | 34.5% |
| Median | 18.0% | 26.5% |
| Interquartile 25% (IQ1) | 15.2% | 21.1% |
| Interquartile 75% (IQ3) | 25.6% | 42.4% |
| Interquartile Range (IQR) | 10.4% | 21.3% |
| Standard Deviation (Sample) | 11.5% | 24.4% |
| Standard Deviation (Population) | 11.3% | 23.9% |
Similar Demographics by Child Poverty Under the Age of 5
Demographics Similar to Immigrants from Oceania by Child Poverty Under the Age of 5
In terms of child poverty under the age of 5, the demographic groups most similar to Immigrants from Oceania are Immigrants from Colombia (16.9%, a difference of 0.090%), Scottish (16.9%, a difference of 0.12%), Costa Rican (16.9%, a difference of 0.27%), English (16.8%, a difference of 0.34%), and Slavic (17.0%, a difference of 0.43%).
| Demographics | Rating | Rank | Child Poverty Under the Age of 5 |
| Venezuelans | 73.7 /100 | #157 | Good 16.8% |
| Czechoslovakians | 72.5 /100 | #158 | Good 16.8% |
| Immigrants | Syria | 72.3 /100 | #159 | Good 16.8% |
| Irish | 72.0 /100 | #160 | Good 16.8% |
| English | 70.4 /100 | #161 | Good 16.8% |
| Costa Ricans | 69.8 /100 | #162 | Good 16.9% |
| Scottish | 68.6 /100 | #163 | Good 16.9% |
| Immigrants | Oceania | 67.6 /100 | #164 | Good 16.9% |
| Immigrants | Colombia | 66.9 /100 | #165 | Good 16.9% |
| Slavs | 64.0 /100 | #166 | Good 17.0% |
| Immigrants | Uzbekistan | 62.0 /100 | #167 | Good 17.0% |
| Uruguayans | 60.5 /100 | #168 | Good 17.0% |
| Immigrants | South America | 60.0 /100 | #169 | Good 17.1% |
| Immigrants | Western Asia | 59.2 /100 | #170 | Average 17.1% |
| Immigrants | Morocco | 58.9 /100 | #171 | Average 17.1% |
Demographics Similar to French American Indians by Child Poverty Under the Age of 5
In terms of child poverty under the age of 5, the demographic groups most similar to French American Indians are Senegalese (20.9%, a difference of 0.23%), Subsaharan African (20.8%, a difference of 0.41%), Potawatomi (21.0%, a difference of 0.77%), Immigrants from Grenada (20.7%, a difference of 0.78%), and Immigrants from West Indies (20.7%, a difference of 0.80%).
| Demographics | Rating | Rank | Child Poverty Under the Age of 5 |
| Central Americans | 0.1 /100 | #273 | Tragic 20.6% |
| Immigrants | Belize | 0.1 /100 | #274 | Tragic 20.6% |
| Bangladeshis | 0.1 /100 | #275 | Tragic 20.6% |
| West Indians | 0.0 /100 | #276 | Tragic 20.6% |
| Immigrants | West Indies | 0.0 /100 | #277 | Tragic 20.7% |
| Immigrants | Grenada | 0.0 /100 | #278 | Tragic 20.7% |
| Sub-Saharan Africans | 0.0 /100 | #279 | Tragic 20.8% |
| French American Indians | 0.0 /100 | #280 | Tragic 20.8% |
| Senegalese | 0.0 /100 | #281 | Tragic 20.9% |
| Potawatomi | 0.0 /100 | #282 | Tragic 21.0% |
| Comanche | 0.0 /100 | #283 | Tragic 21.0% |
| Somalis | 0.0 /100 | #284 | Tragic 21.1% |
| Haitians | 0.0 /100 | #285 | Tragic 21.2% |
| Immigrants | Latin America | 0.0 /100 | #286 | Tragic 21.2% |
| Immigrants | Zaire | 0.0 /100 | #287 | Tragic 21.3% |