Romanian vs Ethiopian Child Poverty Under the Age of 5
COMPARE
Romanian
Ethiopian
Child Poverty Under the Age of 5
Child Poverty Under the Age of 5 Comparison
Romanians
Ethiopians
16.0%
CHILD POVERTY UNDER THE AGE OF 5
94.3/ 100
METRIC RATING
110th/ 347
METRIC RANK
16.5%
CHILD POVERTY UNDER THE AGE OF 5
82.7/ 100
METRIC RATING
144th/ 347
METRIC RANK
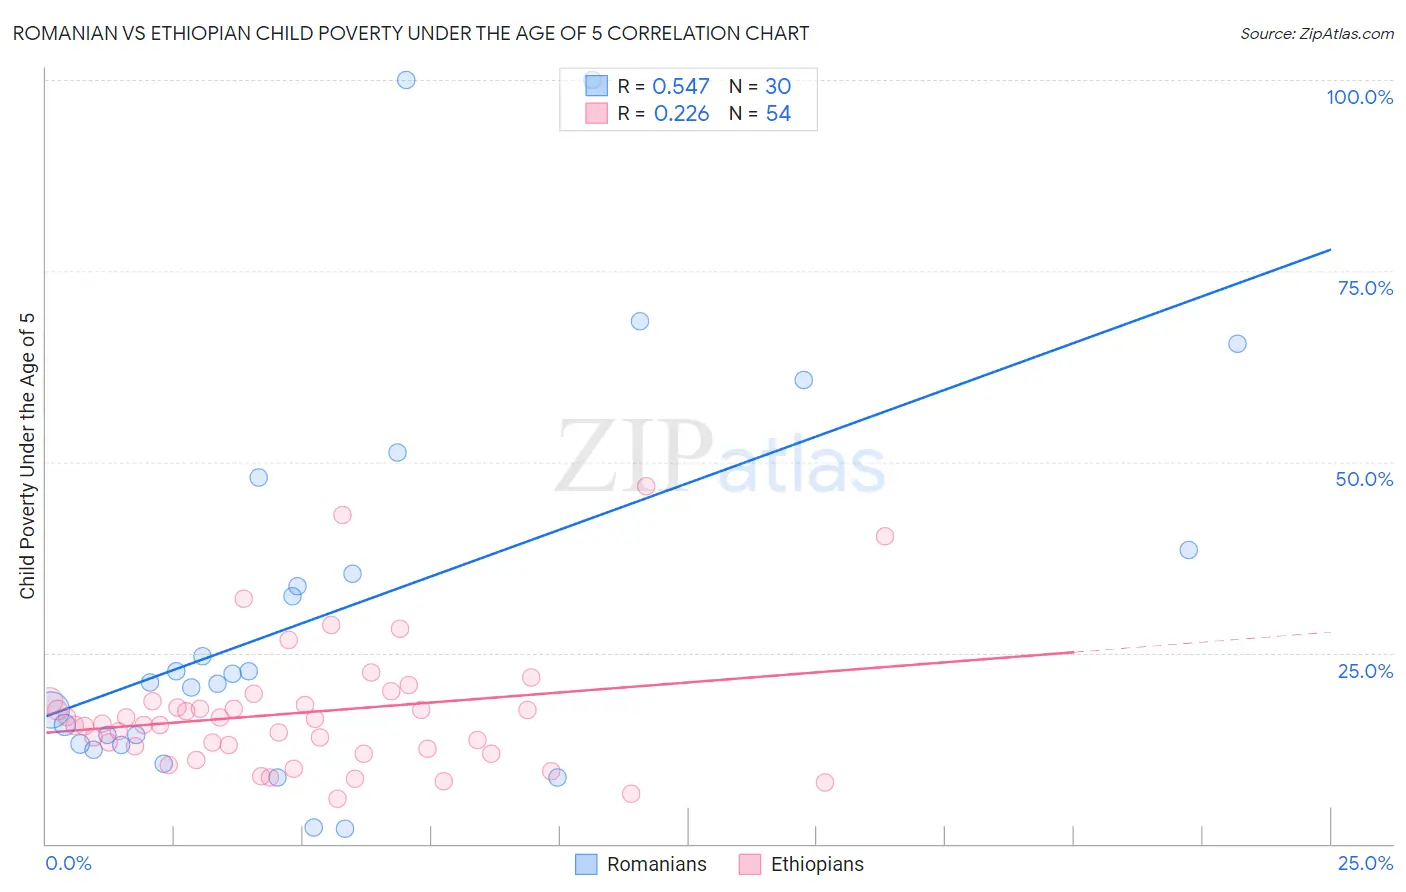
Romanian vs Ethiopian Child Poverty Under the Age of 5 Correlation Chart
The statistical analysis conducted on geographies consisting of 360,104,252 people shows a substantial positive correlation between the proportion of Romanians and poverty level among children under the age of 5 in the United States with a correlation coefficient (R) of 0.547 and weighted average of 16.0%. Similarly, the statistical analysis conducted on geographies consisting of 218,832,621 people shows a weak positive correlation between the proportion of Ethiopians and poverty level among children under the age of 5 in the United States with a correlation coefficient (R) of 0.226 and weighted average of 16.5%, a difference of 3.5%.
Child Poverty Under the Age of 5 Correlation Summary
| Measurement | Romanian | Ethiopian |
| Minimum | 1.9% | 5.9% |
| Maximum | 100.0% | 46.8% |
| Range | 98.1% | 40.9% |
| Mean | 30.7% | 17.2% |
| Median | 21.7% | 15.6% |
| Interquartile 25% (IQ1) | 13.0% | 12.5% |
| Interquartile 75% (IQ3) | 38.5% | 18.6% |
| Interquartile Range (IQR) | 25.4% | 6.2% |
| Standard Deviation (Sample) | 25.9% | 8.4% |
| Standard Deviation (Population) | 25.4% | 8.4% |
Similar Demographics by Child Poverty Under the Age of 5
Demographics Similar to Romanians by Child Poverty Under the Age of 5
In terms of child poverty under the age of 5, the demographic groups most similar to Romanians are Northern European (16.0%, a difference of 0.010%), Pakistani (16.0%, a difference of 0.040%), Immigrants from Brazil (16.0%, a difference of 0.090%), Peruvian (16.0%, a difference of 0.090%), and Slovene (16.0%, a difference of 0.10%).
| Demographics | Rating | Rank | Child Poverty Under the Age of 5 |
| Europeans | 95.3 /100 | #103 | Exceptional 15.9% |
| Immigrants | North America | 94.9 /100 | #104 | Exceptional 15.9% |
| Immigrants | Spain | 94.8 /100 | #105 | Exceptional 15.9% |
| Tlingit-Haida | 94.7 /100 | #106 | Exceptional 15.9% |
| Slovenes | 94.4 /100 | #107 | Exceptional 16.0% |
| Immigrants | Brazil | 94.4 /100 | #108 | Exceptional 16.0% |
| Northern Europeans | 94.3 /100 | #109 | Exceptional 16.0% |
| Romanians | 94.3 /100 | #110 | Exceptional 16.0% |
| Pakistanis | 94.2 /100 | #111 | Exceptional 16.0% |
| Peruvians | 94.1 /100 | #112 | Exceptional 16.0% |
| Puget Sound Salish | 94.1 /100 | #113 | Exceptional 16.0% |
| Immigrants | Kuwait | 93.9 /100 | #114 | Exceptional 16.0% |
| Albanians | 93.8 /100 | #115 | Exceptional 16.0% |
| Immigrants | Austria | 93.5 /100 | #116 | Exceptional 16.0% |
| Basques | 93.4 /100 | #117 | Exceptional 16.0% |
Demographics Similar to Ethiopians by Child Poverty Under the Age of 5
In terms of child poverty under the age of 5, the demographic groups most similar to Ethiopians are Samoan (16.5%, a difference of 0.060%), Portuguese (16.5%, a difference of 0.070%), Immigrants from Western Europe (16.5%, a difference of 0.11%), Immigrants from Ethiopia (16.6%, a difference of 0.11%), and Israeli (16.6%, a difference of 0.12%).
| Demographics | Rating | Rank | Child Poverty Under the Age of 5 |
| Immigrants | Chile | 85.3 /100 | #137 | Excellent 16.4% |
| Germans | 84.8 /100 | #138 | Excellent 16.5% |
| Immigrants | Hungary | 84.5 /100 | #139 | Excellent 16.5% |
| Guamanians/Chamorros | 84.2 /100 | #140 | Excellent 16.5% |
| Immigrants | Western Europe | 83.3 /100 | #141 | Excellent 16.5% |
| Portuguese | 83.0 /100 | #142 | Excellent 16.5% |
| Samoans | 83.0 /100 | #143 | Excellent 16.5% |
| Ethiopians | 82.7 /100 | #144 | Excellent 16.5% |
| Immigrants | Ethiopia | 82.1 /100 | #145 | Excellent 16.6% |
| Israelis | 82.0 /100 | #146 | Excellent 16.6% |
| Immigrants | Nepal | 80.3 /100 | #147 | Excellent 16.6% |
| Syrians | 79.1 /100 | #148 | Good 16.6% |
| New Zealanders | 78.7 /100 | #149 | Good 16.6% |
| Colombians | 77.8 /100 | #150 | Good 16.7% |
| Canadians | 77.6 /100 | #151 | Good 16.7% |