Scottish vs Ethiopian Child Poverty Under the Age of 5
COMPARE
Scottish
Ethiopian
Child Poverty Under the Age of 5
Child Poverty Under the Age of 5 Comparison
Scottish
Ethiopians
16.9%
CHILD POVERTY UNDER THE AGE OF 5
68.6/ 100
METRIC RATING
163rd/ 347
METRIC RANK
16.5%
CHILD POVERTY UNDER THE AGE OF 5
82.7/ 100
METRIC RATING
144th/ 347
METRIC RANK
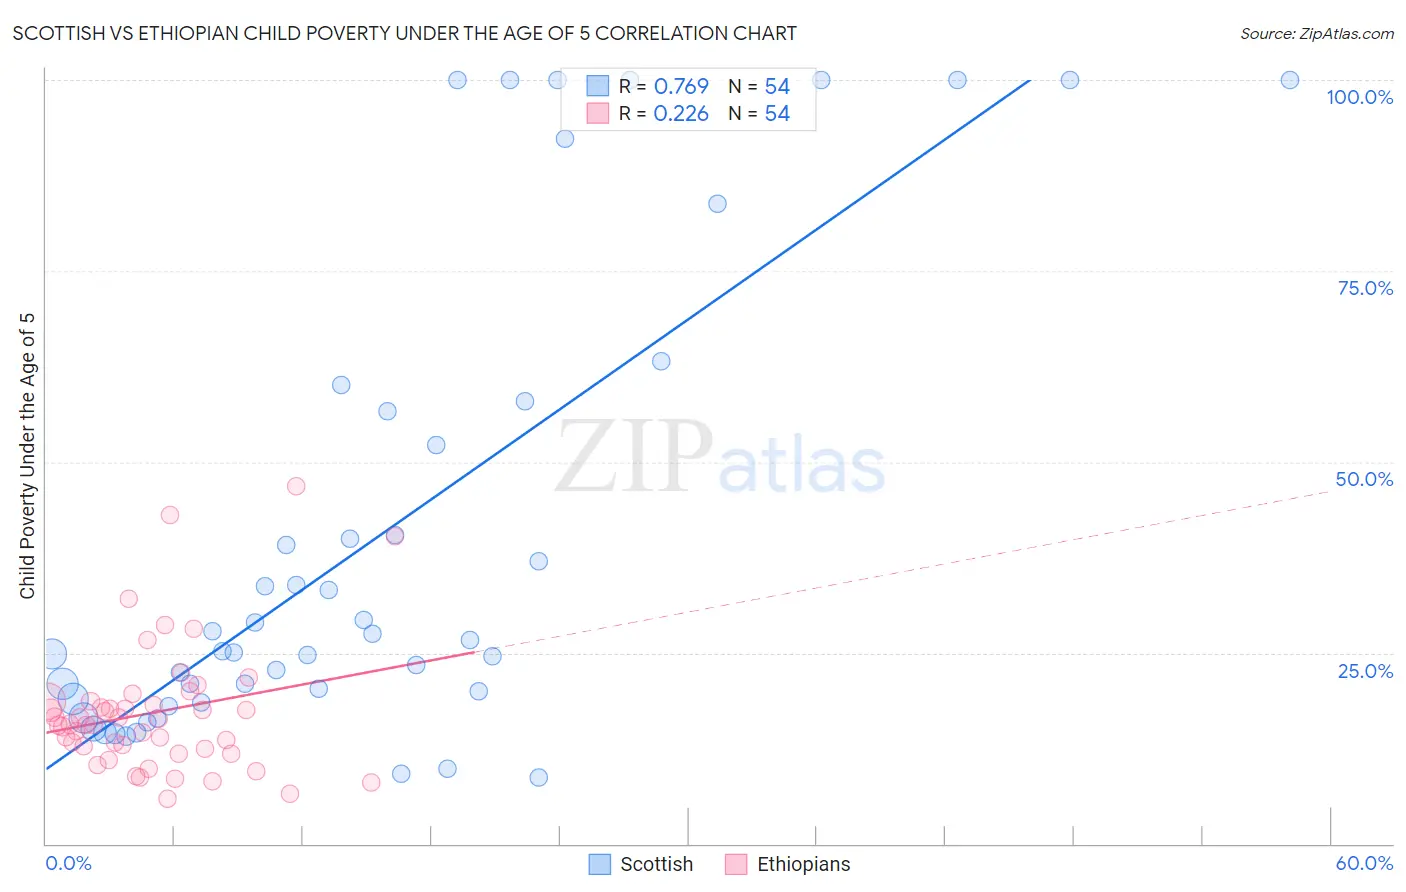
Scottish vs Ethiopian Child Poverty Under the Age of 5 Correlation Chart
The statistical analysis conducted on geographies consisting of 526,633,659 people shows a strong positive correlation between the proportion of Scottish and poverty level among children under the age of 5 in the United States with a correlation coefficient (R) of 0.769 and weighted average of 16.9%. Similarly, the statistical analysis conducted on geographies consisting of 218,832,621 people shows a weak positive correlation between the proportion of Ethiopians and poverty level among children under the age of 5 in the United States with a correlation coefficient (R) of 0.226 and weighted average of 16.5%, a difference of 2.1%.
Child Poverty Under the Age of 5 Correlation Summary
| Measurement | Scottish | Ethiopian |
| Minimum | 8.7% | 5.9% |
| Maximum | 100.0% | 46.8% |
| Range | 91.3% | 40.9% |
| Mean | 40.1% | 17.2% |
| Median | 25.9% | 15.6% |
| Interquartile 25% (IQ1) | 18.9% | 12.5% |
| Interquartile 75% (IQ3) | 56.6% | 18.6% |
| Interquartile Range (IQR) | 37.6% | 6.2% |
| Standard Deviation (Sample) | 30.4% | 8.4% |
| Standard Deviation (Population) | 30.1% | 8.4% |
Demographics Similar to Scottish and Ethiopians by Child Poverty Under the Age of 5
In terms of child poverty under the age of 5, the demographic groups most similar to Scottish are Costa Rican (16.9%, a difference of 0.15%), English (16.8%, a difference of 0.21%), Irish (16.8%, a difference of 0.43%), Immigrants from Syria (16.8%, a difference of 0.46%), and Czechoslovakian (16.8%, a difference of 0.50%). Similarly, the demographic groups most similar to Ethiopians are Samoan (16.5%, a difference of 0.060%), Immigrants from Ethiopia (16.6%, a difference of 0.11%), Israeli (16.6%, a difference of 0.12%), Immigrants from Nepal (16.6%, a difference of 0.44%), and Syrian (16.6%, a difference of 0.63%).
| Demographics | Rating | Rank | Child Poverty Under the Age of 5 |
| Samoans | 83.0 /100 | #143 | Excellent 16.5% |
| Ethiopians | 82.7 /100 | #144 | Excellent 16.5% |
| Immigrants | Ethiopia | 82.1 /100 | #145 | Excellent 16.6% |
| Israelis | 82.0 /100 | #146 | Excellent 16.6% |
| Immigrants | Nepal | 80.3 /100 | #147 | Excellent 16.6% |
| Syrians | 79.1 /100 | #148 | Good 16.6% |
| New Zealanders | 78.7 /100 | #149 | Good 16.6% |
| Colombians | 77.8 /100 | #150 | Good 16.7% |
| Canadians | 77.6 /100 | #151 | Good 16.7% |
| Belgians | 77.2 /100 | #152 | Good 16.7% |
| Dutch | 77.1 /100 | #153 | Good 16.7% |
| Immigrants | Venezuela | 76.0 /100 | #154 | Good 16.7% |
| South Americans | 75.1 /100 | #155 | Good 16.7% |
| Afghans | 74.4 /100 | #156 | Good 16.8% |
| Venezuelans | 73.7 /100 | #157 | Good 16.8% |
| Czechoslovakians | 72.5 /100 | #158 | Good 16.8% |
| Immigrants | Syria | 72.3 /100 | #159 | Good 16.8% |
| Irish | 72.0 /100 | #160 | Good 16.8% |
| English | 70.4 /100 | #161 | Good 16.8% |
| Costa Ricans | 69.8 /100 | #162 | Good 16.9% |
| Scottish | 68.6 /100 | #163 | Good 16.9% |