Immigrants from Northern Europe vs Welsh Child Poverty Among Girls Under 16
COMPARE
Immigrants from Northern Europe
Welsh
Child Poverty Among Girls Under 16
Child Poverty Among Girls Under 16 Comparison
Immigrants from Northern Europe
Welsh
13.8%
CHILD POVERTY AMONG GIRLS UNDER 16
99.6/ 100
METRIC RATING
35th/ 347
METRIC RANK
15.6%
CHILD POVERTY AMONG GIRLS UNDER 16
85.4/ 100
METRIC RATING
145th/ 347
METRIC RANK
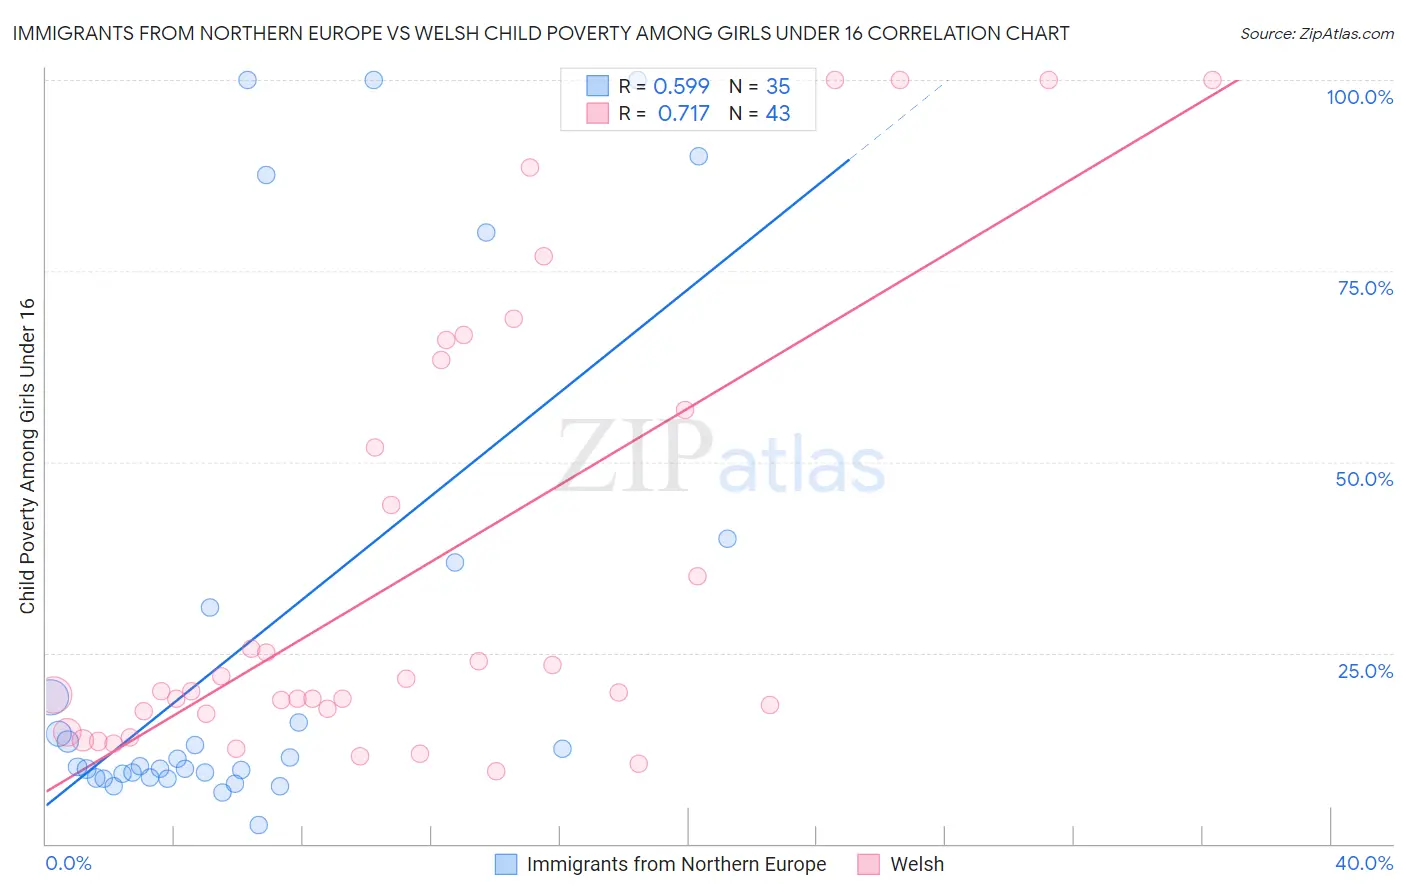
Immigrants from Northern Europe vs Welsh Child Poverty Among Girls Under 16 Correlation Chart
The statistical analysis conducted on geographies consisting of 463,851,926 people shows a substantial positive correlation between the proportion of Immigrants from Northern Europe and poverty level among girls under the age of 16 in the United States with a correlation coefficient (R) of 0.599 and weighted average of 13.8%. Similarly, the statistical analysis conducted on geographies consisting of 511,157,850 people shows a strong positive correlation between the proportion of Welsh and poverty level among girls under the age of 16 in the United States with a correlation coefficient (R) of 0.717 and weighted average of 15.6%, a difference of 13.0%.
Child Poverty Among Girls Under 16 Correlation Summary
| Measurement | Immigrants from Northern Europe | Welsh |
| Minimum | 2.4% | 9.5% |
| Maximum | 100.0% | 100.0% |
| Range | 97.6% | 90.5% |
| Mean | 26.6% | 35.5% |
| Median | 10.2% | 19.9% |
| Interquartile 25% (IQ1) | 8.7% | 17.0% |
| Interquartile 75% (IQ3) | 30.9% | 56.9% |
| Interquartile Range (IQR) | 22.2% | 39.8% |
| Standard Deviation (Sample) | 31.8% | 29.1% |
| Standard Deviation (Population) | 31.3% | 28.8% |
Similar Demographics by Child Poverty Among Girls Under 16
Demographics Similar to Immigrants from Northern Europe by Child Poverty Among Girls Under 16
In terms of child poverty among girls under 16, the demographic groups most similar to Immigrants from Northern Europe are Russian (13.9%, a difference of 0.15%), Lithuanian (13.9%, a difference of 0.17%), Immigrants from Moldova (13.9%, a difference of 0.47%), Maltese (13.7%, a difference of 0.98%), and Swedish (13.7%, a difference of 1.0%).
| Demographics | Rating | Rank | Child Poverty Among Girls Under 16 |
| Tongans | 99.8 /100 | #28 | Exceptional 13.6% |
| Bolivians | 99.8 /100 | #29 | Exceptional 13.6% |
| Asians | 99.7 /100 | #30 | Exceptional 13.7% |
| Turks | 99.7 /100 | #31 | Exceptional 13.7% |
| Danes | 99.7 /100 | #32 | Exceptional 13.7% |
| Swedes | 99.7 /100 | #33 | Exceptional 13.7% |
| Maltese | 99.7 /100 | #34 | Exceptional 13.7% |
| Immigrants | Northern Europe | 99.6 /100 | #35 | Exceptional 13.8% |
| Russians | 99.6 /100 | #36 | Exceptional 13.9% |
| Lithuanians | 99.6 /100 | #37 | Exceptional 13.9% |
| Immigrants | Moldova | 99.6 /100 | #38 | Exceptional 13.9% |
| Immigrants | Australia | 99.5 /100 | #39 | Exceptional 14.0% |
| Immigrants | Sri Lanka | 99.5 /100 | #40 | Exceptional 14.0% |
| Immigrants | Bolivia | 99.5 /100 | #41 | Exceptional 14.0% |
| Immigrants | Scotland | 99.4 /100 | #42 | Exceptional 14.0% |
Demographics Similar to Welsh by Child Poverty Among Girls Under 16
In terms of child poverty among girls under 16, the demographic groups most similar to Welsh are Israeli (15.6%, a difference of 0.20%), Immigrants from Peru (15.6%, a difference of 0.29%), Samoan (15.7%, a difference of 0.29%), Canadian (15.6%, a difference of 0.44%), and Immigrants from Jordan (15.6%, a difference of 0.46%).
| Demographics | Rating | Rank | Child Poverty Among Girls Under 16 |
| Immigrants | Vietnam | 88.2 /100 | #138 | Excellent 15.5% |
| Armenians | 87.9 /100 | #139 | Excellent 15.5% |
| New Zealanders | 87.2 /100 | #140 | Excellent 15.6% |
| Immigrants | Jordan | 87.2 /100 | #141 | Excellent 15.6% |
| Canadians | 87.1 /100 | #142 | Excellent 15.6% |
| Immigrants | Peru | 86.6 /100 | #143 | Excellent 15.6% |
| Israelis | 86.3 /100 | #144 | Excellent 15.6% |
| Welsh | 85.4 /100 | #145 | Excellent 15.6% |
| Samoans | 84.2 /100 | #146 | Excellent 15.7% |
| Slavs | 83.1 /100 | #147 | Excellent 15.7% |
| Icelanders | 82.4 /100 | #148 | Excellent 15.7% |
| Immigrants | Hungary | 80.9 /100 | #149 | Excellent 15.8% |
| Immigrants | Albania | 80.7 /100 | #150 | Excellent 15.8% |
| Venezuelans | 80.1 /100 | #151 | Excellent 15.8% |
| Immigrants | Kuwait | 79.4 /100 | #152 | Good 15.8% |