Immigrants from Northern Europe vs Immigrants from Zaire Child Poverty Among Girls Under 16
COMPARE
Immigrants from Northern Europe
Immigrants from Zaire
Child Poverty Among Girls Under 16
Child Poverty Among Girls Under 16 Comparison
Immigrants from Northern Europe
Immigrants from Zaire
13.8%
CHILD POVERTY AMONG GIRLS UNDER 16
99.6/ 100
METRIC RATING
35th/ 347
METRIC RANK
20.2%
CHILD POVERTY AMONG GIRLS UNDER 16
0.0/ 100
METRIC RATING
279th/ 347
METRIC RANK
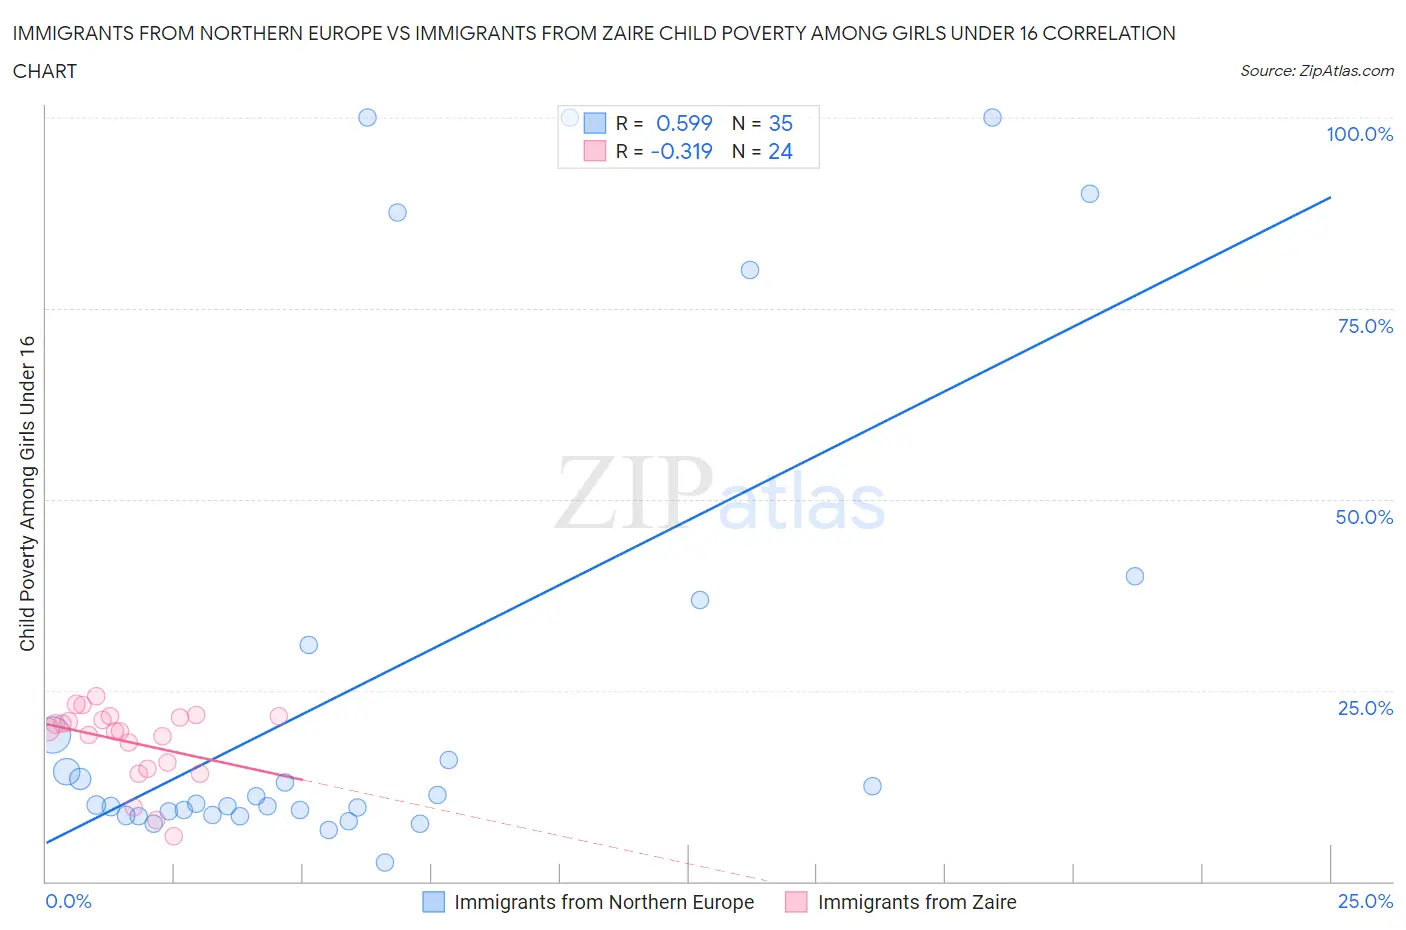
Immigrants from Northern Europe vs Immigrants from Zaire Child Poverty Among Girls Under 16 Correlation Chart
The statistical analysis conducted on geographies consisting of 463,851,926 people shows a substantial positive correlation between the proportion of Immigrants from Northern Europe and poverty level among girls under the age of 16 in the United States with a correlation coefficient (R) of 0.599 and weighted average of 13.8%. Similarly, the statistical analysis conducted on geographies consisting of 106,950,173 people shows a mild negative correlation between the proportion of Immigrants from Zaire and poverty level among girls under the age of 16 in the United States with a correlation coefficient (R) of -0.319 and weighted average of 20.2%, a difference of 46.2%.
Child Poverty Among Girls Under 16 Correlation Summary
| Measurement | Immigrants from Northern Europe | Immigrants from Zaire |
| Minimum | 2.4% | 5.9% |
| Maximum | 100.0% | 24.2% |
| Range | 97.6% | 18.4% |
| Mean | 26.6% | 18.2% |
| Median | 10.2% | 19.8% |
| Interquartile 25% (IQ1) | 8.7% | 15.1% |
| Interquartile 75% (IQ3) | 30.9% | 21.5% |
| Interquartile Range (IQR) | 22.2% | 6.4% |
| Standard Deviation (Sample) | 31.8% | 4.9% |
| Standard Deviation (Population) | 31.3% | 4.8% |
Similar Demographics by Child Poverty Among Girls Under 16
Demographics Similar to Immigrants from Northern Europe by Child Poverty Among Girls Under 16
In terms of child poverty among girls under 16, the demographic groups most similar to Immigrants from Northern Europe are Russian (13.9%, a difference of 0.15%), Lithuanian (13.9%, a difference of 0.17%), Immigrants from Moldova (13.9%, a difference of 0.47%), Maltese (13.7%, a difference of 0.98%), and Swedish (13.7%, a difference of 1.0%).
| Demographics | Rating | Rank | Child Poverty Among Girls Under 16 |
| Tongans | 99.8 /100 | #28 | Exceptional 13.6% |
| Bolivians | 99.8 /100 | #29 | Exceptional 13.6% |
| Asians | 99.7 /100 | #30 | Exceptional 13.7% |
| Turks | 99.7 /100 | #31 | Exceptional 13.7% |
| Danes | 99.7 /100 | #32 | Exceptional 13.7% |
| Swedes | 99.7 /100 | #33 | Exceptional 13.7% |
| Maltese | 99.7 /100 | #34 | Exceptional 13.7% |
| Immigrants | Northern Europe | 99.6 /100 | #35 | Exceptional 13.8% |
| Russians | 99.6 /100 | #36 | Exceptional 13.9% |
| Lithuanians | 99.6 /100 | #37 | Exceptional 13.9% |
| Immigrants | Moldova | 99.6 /100 | #38 | Exceptional 13.9% |
| Immigrants | Australia | 99.5 /100 | #39 | Exceptional 14.0% |
| Immigrants | Sri Lanka | 99.5 /100 | #40 | Exceptional 14.0% |
| Immigrants | Bolivia | 99.5 /100 | #41 | Exceptional 14.0% |
| Immigrants | Scotland | 99.4 /100 | #42 | Exceptional 14.0% |
Demographics Similar to Immigrants from Zaire by Child Poverty Among Girls Under 16
In terms of child poverty among girls under 16, the demographic groups most similar to Immigrants from Zaire are Immigrants from Liberia (20.2%, a difference of 0.010%), Central American (20.2%, a difference of 0.080%), Barbadian (20.2%, a difference of 0.13%), Belizean (20.2%, a difference of 0.16%), and Comanche (20.2%, a difference of 0.27%).
| Demographics | Rating | Rank | Child Poverty Among Girls Under 16 |
| Immigrants | El Salvador | 0.1 /100 | #272 | Tragic 20.0% |
| Bangladeshis | 0.1 /100 | #273 | Tragic 20.0% |
| Immigrants | St. Vincent and the Grenadines | 0.0 /100 | #274 | Tragic 20.1% |
| Sub-Saharan Africans | 0.0 /100 | #275 | Tragic 20.1% |
| Comanche | 0.0 /100 | #276 | Tragic 20.2% |
| Belizeans | 0.0 /100 | #277 | Tragic 20.2% |
| Barbadians | 0.0 /100 | #278 | Tragic 20.2% |
| Immigrants | Zaire | 0.0 /100 | #279 | Tragic 20.2% |
| Immigrants | Liberia | 0.0 /100 | #280 | Tragic 20.2% |
| Central Americans | 0.0 /100 | #281 | Tragic 20.2% |
| West Indians | 0.0 /100 | #282 | Tragic 20.3% |
| Senegalese | 0.0 /100 | #283 | Tragic 20.3% |
| Yaqui | 0.0 /100 | #284 | Tragic 20.3% |
| Immigrants | Cabo Verde | 0.0 /100 | #285 | Tragic 20.3% |
| Iroquois | 0.0 /100 | #286 | Tragic 20.4% |